Poverty

Behind every poverty statistic is a human reality. At Datapott Analytics’ we analyze data on poverty in all its dimensions; from extreme deprivation and child poverty to working poverty, inequality, and the global race to meet the 2030 zero-poverty target. Explore the data, understand the trends, and see what the evidence says.

The World Has Halved Extreme Poverty Since 1990 – But COVID Reversed 25 Years of Progress in a Single Year
[wpdatachart id=12]

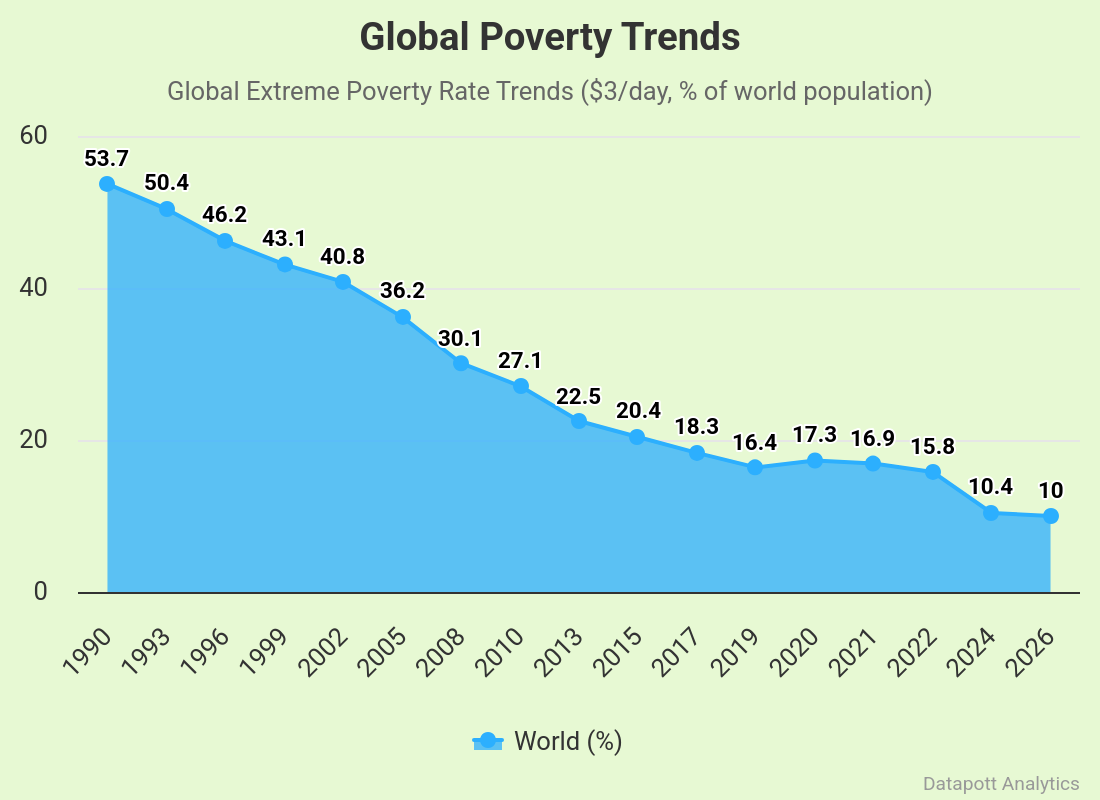
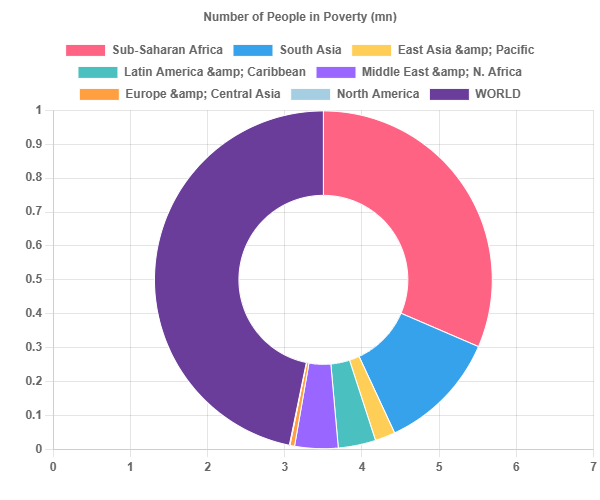
In 1990, more than half the world (53.7%) lived in extreme poverty; by 2024 that figure had fallen to 10.4%, lifting an estimated 1.5 billion people out of destitution over three decades. Yet in 2020, COVID-19 erased a generation of gains in a single year, and today, 847 million people still survive on less than $3 a day.

The fastest decade of reduction was 2000 – 2010, when the rate fell 16%, largely driven by China’s rapid industrialisation and economic reforms lifting hundreds of millions out of poverty.

 
East Asia Cut Its Poverty Rate by 57 Points in 32 Years, While Sub-Saharan Africa Has Slightly Moved in Three Decades

[wpdatachart id=13]

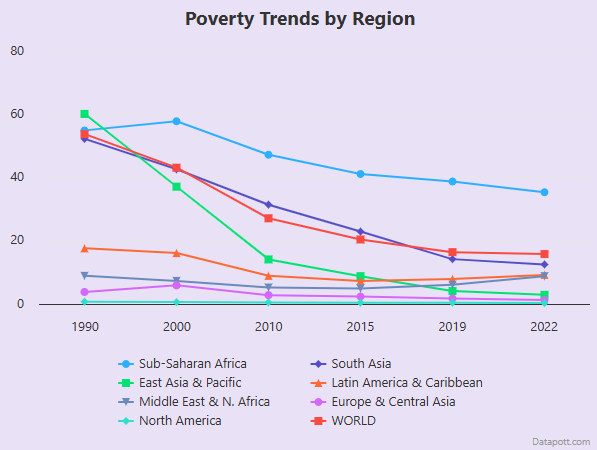
Sub-Saharan Africa is the world’s most poverty-stricken region, and the least improved. Its rate fell from 54.9% in 1990 to 35.3% in 2022, a reduction of only 19.6 percentage points while its population more than doubled, meaning the absolute number of poor actually rose.

East Asia & Pacific achieved the most dramatic regional poverty reduction in history, from 60.1% in 1990 to 2.9% in 2022, a 57.2-point collapse driven overwhelmingly by China’s economic transformation.

Data Insights on Poverty