Summary
- The global extreme poverty rate dropped from 53.7% in 1990 to 10.4% in 2024, a reduction of 43% in 34 years, representing one of the most dramatic improvements in human welfare ever recorded.
- The fastest decade of reduction was 2000 – 2010, when the rate fell 16%, largely driven by China’s rapid industrialisation and economic reforms lifting hundreds of millions out of poverty.
- COVID-19 caused the first rise in global poverty in 25 years: the rate jumped from 16.4% in 2019 to 17.3% in 2020, pushing an estimated 90 million additional people below the poverty line in a single year.
- By 2022, global poverty had recovered to 15.8% — but under the revised $3/day International Poverty Line (2021 PPP), the 2024 nowcast stands at 10.4%, with 847 million still in extreme poverty.
- The world is off track to meet SDG Goal 1 by 2030: on current trajectory, 8.9% of the global population (over 800 million people) will still live in extreme poverty when the deadline arrives.

Research Insights
The global poverty data tells a story of extraordinary progress shadowed by stubborn fragility. Between 1990 and 2019, the world achieved what many once thought impossible. The share of humanity living in extreme poverty fell from over half to just 16.4%, a decline powered primarily by East Asia’s economic transformation and, above all, China, which alone accounted for the majority of global poverty reduction. The 2000–2010 decade was the most productive, delivering a 16 percentage point fall, the equivalent of pulling roughly 700 million people above the poverty line in a single decade.
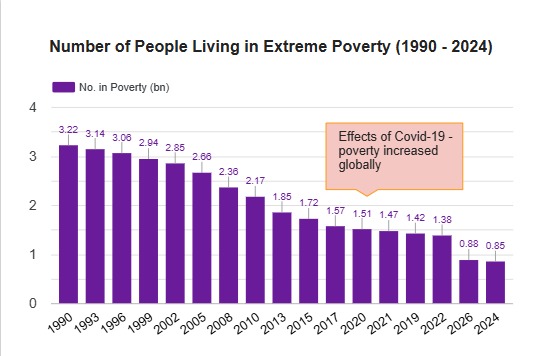
Then came COVID-19. In 2020 alone, the poverty rate rose by nearly a full percentage point, the first increase in 25 years, reversing years of careful gains and adding an estimated 90 million people to the poverty count. The asymmetric nature of the shock is telling: South Asia and Sub-Saharan Africa absorbed the deepest blows, while higher-income regions recovered quickly. This divergence mirrors a wider structural truth: global poverty reduction has always been uneven, and the pandemic simply made the fault lines visible.
Looking ahead, the 2030 SDG target of zero extreme poverty is clearly out of reach on current trajectories. Projections place the 2030 rate at 8.9% — nearly 9 times the target. Without a step-change in investment, social protection, and conflict resolution, over 800 million people will still be living on less than $3 a day when the SDG deadline arrives.
Policy Recommendations
- Pandemic-Proof Social Protection: Governments must build permanent, shock-responsive social protection floors before the next crisis hits. The COVID reversal proved that gains achieved over decades can be wiped out in months without robust safety nets.
- Accelerate Sub-Saharan Africa Investment: With a 46% poverty rate and rising population, Sub-Saharan Africa requires targeted investment in agriculture, infrastructure, and education to prevent its share of global poverty from continuing to grow.
- Close the $1.4 Trillion Social Protection Gap: Low and middle-income countries need an additional $1.4 trillion annually to guarantee basic social floors. This requires both domestic revenue mobilisation and a reformed international development finance architecture.
- Address Working Poverty: With 240 million workers still earning below $3/day, raising minimum wages, formalising labour markets, and expanding workers’ rights in the informal economy must be central to poverty reduction strategies.
- Conflict Resolution as Poverty Policy: Nearly 40% of the world’s extreme poor live in conflict-affected countries. Diplomatic and peacekeeping investments are direct poverty interventions and should be funded and evaluated as such.