Analysis Summary:
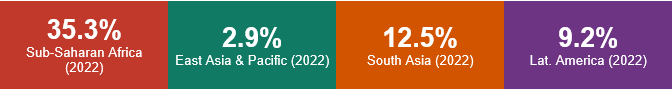
Sub-Saharan Africa is the world’s most poverty-stricken region, and the least improved. Its rate fell from 54.9% in 1990 to 35.3% in 2022, a reduction of only 19.6 percentage points while its population more than doubled, meaning the absolute number of poor actually rose.
East Asia & Pacific achieved the most dramatic regional poverty reduction in history, from 60.1% in 1990 to 2.9% in 2022, a 57.2-point collapse driven overwhelmingly by China’s economic transformation.
South Asia posted impressive but uneven gains, from 52.2% in 1990 to 12.5% in 2022, led by Bangladesh and India, though Afghanistan’s collapse post-2021 has reversed regional progress.
Latin America & Caribbean is the only region where poverty rose between 2019 and 2022, climbing from 7.3% back to 9.2%, reflecting COVID’s lasting damage to an already fragile economic recovery.
Europe & Central Asia and North America maintain the lowest rates globally at 1.3% and 0.3% respectively, but even these regions saw temporary increases in the early 2000s following post-Soviet economic shocks.
How Far Has Each Region Come? 1990 vs 2022
The regional breakdown of extreme poverty is one of the most revealing datasets in global development, because it exposes just how unequal the story of progress has been. On the surface, the global decline from 53.7% to 10.4% sounds like a shared human achievement.
In reality, it is largely the story of one region: East Asia & Pacific. That region alone fell 57 percentage points over 32 years, dragging the global average down while masking the stagnation elsewhere. Remove East Asia from the global numbers, and the picture of progress looks far grimmer.
Sub-Saharan Africa’s trajectory is the defining challenge of global poverty. Despite falling from 54.9% to 35.3%, the region’s rapid population growth, the fastest of any world region, means that the absolute number of people in extreme poverty has increased, not decreased. By 2030, Sub-Saharan Africa is projected to be home to nearly 90% of the world’s extreme poor. Percentage points are improving; human counts are not. This distinction is critical for policymakers and donors who risk being misled by falling rates.
Meanwhile, Latin America’s poverty backslide, from 7.3% in 2015 to 9.2% in 2022, illustrates how fragile middle-income country progress can be. The region had come so far, yet COVID-19 and weak institutions unravelled years of work. The Middle East & North Africa tells a similar cautionary tale: poverty rose from 4.9% in 2015 to 8.8% in 2022, driven by conflict, data revisions, and economic mismanagement. Progress is never permanently secured, it must be actively defended.
Policy Recommendations
Track Absolute Numbers, Not Just Rates: Policymakers and donors must report both poverty rates and absolute headcounts. Sub-Saharan Africa’s falling rate masks a rising absolute poor population, a distinction that fundamentally changes the required policy response.
Replicate the East Asia Model Selectively: East Asia’s success was built on export-led growth, land reform, mass education, and sustained public investment. While not perfectly transferable, its core pillars, particularly investment in agricultural productivity and manufacturing job creation, hold lessons for Sub-Saharan Africa and South Asia.
Prioritise Fragile and Conflict-Affected Regions: The MENA region’s poverty rise from 4.9% to 8.8% between 2015 and 2022 is a direct result of conflict. Development finance must be paired with diplomatic and peacekeeping investment to prevent poverty from re-entrenching in unstable regions.
Protect Latin America’s Middle-Income Gains: Latin America proved in 2020-2022 that poverty can spike rapidly in middle-income countries without strong automatic stabilisers. Governments must invest in permanent social safety nets rather than one-off transfers that disappear when fiscal pressure rises.
Target Demographic Dividends in Sub-Saharan Africa: Sub-Saharan Africa’s young, fast-growing population is either its greatest development asset or its greatest risk. Investing in quality education, girls’ schooling, family planning access, and youth employment now will determine which outcome prevails by 2050.
Poverty Trends by Region
This is selected data for the global trends of poverty by regions for the periods between 1990 and 2022.