Today i will teach you How to Conduct Chi-Square Test using SPSS
Test Procedure in SPSS Statistics
The 13 steps below show you how to analyse your data using a chi-square test for independence in SPSS Statistics. At the end of these 13 steps, we show you how to interpret the results from your chi-square test for independence.
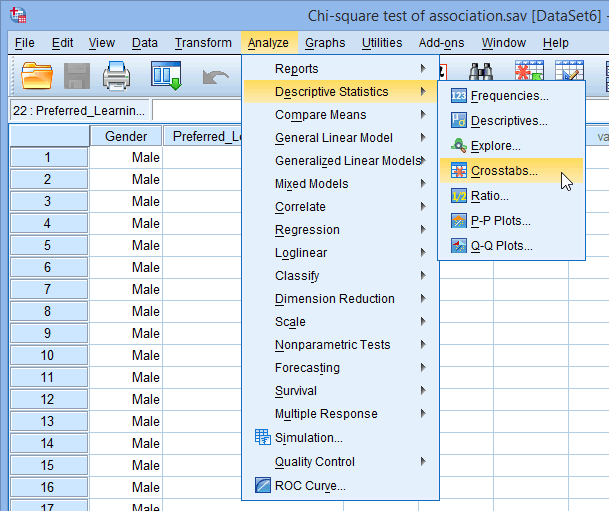
- Click Analyze > Descriptives Statistics > Crosstabs… on the top menu, as shown below:
 Published with written permission from SPSS Statistics, IBM Corporation.
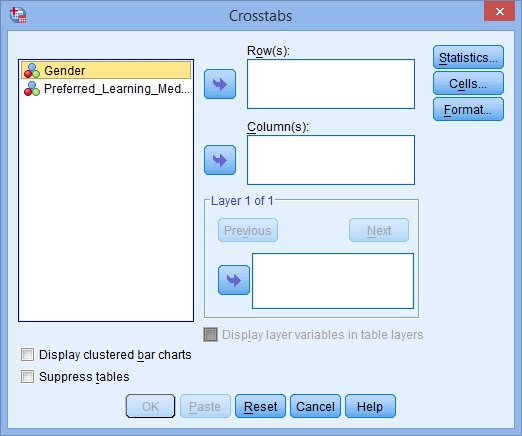
 - You will be presented with the following Crosstabs dialogue box:
 Published with written permission from SPSS Statistics, IBM Corporation.
 - Transfer one of the variables into the Row(s): box and the other variable into the Column(s): box. In our example, we will transfer the Gender variable into the Row(s): box and Preferred_Learning_Medium into the Column(s): box. There are two ways to do this. You can either: (1) highlight the variable with your mouse and then use the relevant
 buttons to transfer the variables; or (2) drag-and-drop the variables. How do you know which variable goes in the row or column box? There is no right or wrong way. It will depend on how you want to present your data.
If you want to display clustered bar charts (recommended), make sure that Display clustered bar charts checkbox is ticked.
You will end up with a screen similar to the one below: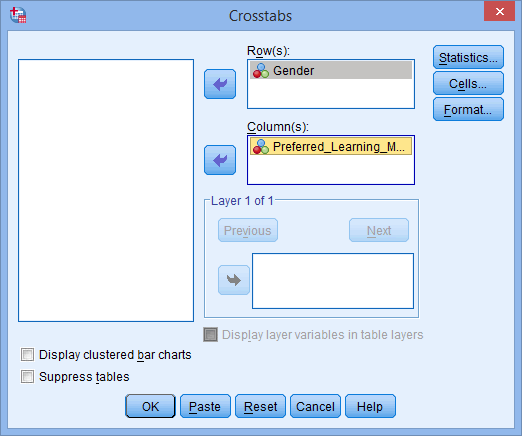 Published with written permission from SPSS Statistics, IBM Corporation.
 - Click on the
 button. You will be presented with the following Crosstabs: Statistics dialogue box:
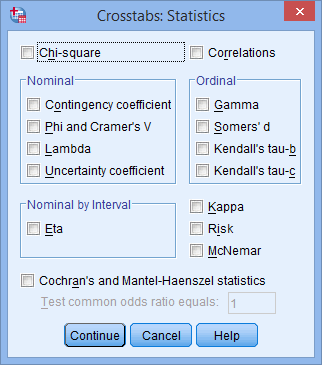
- Select the Chi-square and Phi and Cramer’s V options, as shown below:
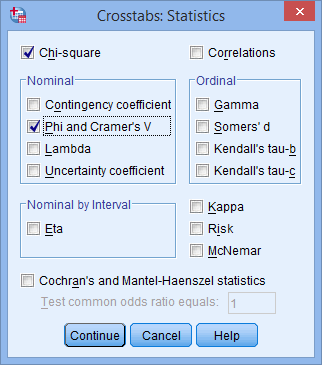
- Published with written permission from SPSS Statistics, IBM Corporation.
- Click on the
 button.
 - Click on the
 button. You will be presented with the following Crosstabs: Cell Display dialogue box:
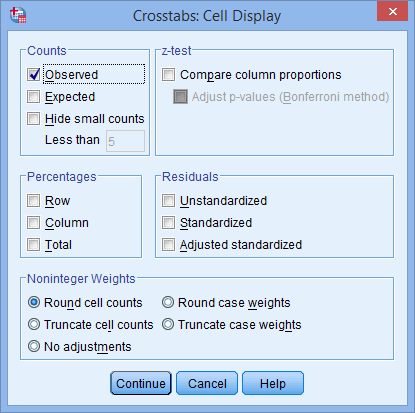 Published with written permission from SPSS Statistics, IBM Corporation.
 - Select Observed from the –Counts– area, and Row, Column and Total from the –Percentages– area, as shown below:
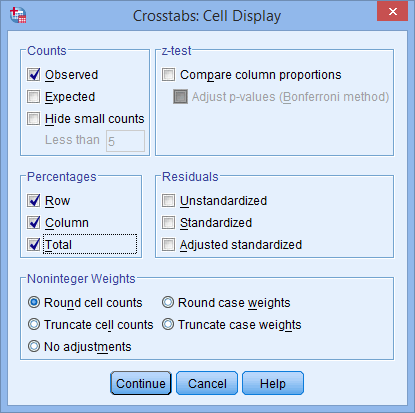 Published with written permission from SPSS Statistics, IBM Corporation.
 - Click on the button.
- Click on the
 button.Note: This next option is only really useful if you have more than two categories in one of your variables, but we will show it here in case you have. If you don’t, you can skip to STEP 12.
 - You will be presented with the following:
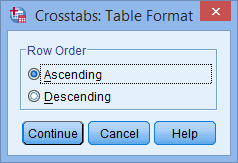 Published with written permission from SPSS Statistics, IBM Corporation.This option allows you to change the order of the values to either ascending or descending.
 - Once you have made your choice, click on the button.
- Click on the
 button to generate your output.
Follow this link to Learn How to Interpret Chi-Square Output in SPSS
