Todayi will teach you How to Interpret Chi-Square Output in SPSS
Output
You will be presented with some tables in the Output Viewer under the title “Crosstabs”. The tables of note are presented below:
The Crosstabulation Table (Gender*Preferred Learning Medium Crosstabulation)
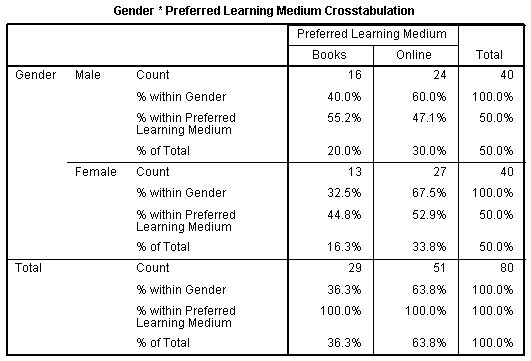
Published with written permission from SPSS Statistics, IBM Corporation.
This table allows us to understand that both males and females prefer to learn using online materials versus books.
The Chi-Square Tests Table
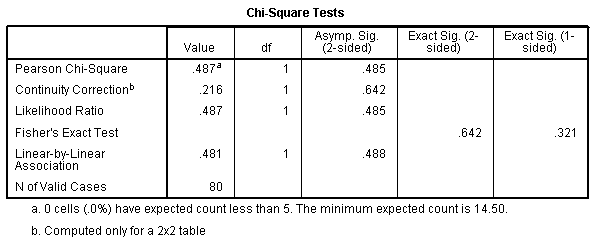
Published with written permission from SPSS Statistics, IBM Corporation.
When reading this table we are interested in the results of the “Pearson Chi-Square” row. We can see here that χ(1) = 0.487, p = .485. This tells us that there is no statistically significant association between Gender and Preferred Learning Medium; that is, both Males and Females equally prefer online learning versus books.
The Symmetric Measures Table
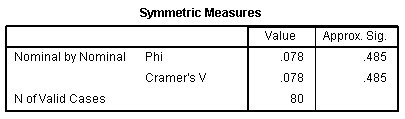
Published with written permission from SPSS Statistics, IBM Corporation.
Phi and Cramer’s V are both tests of the strength of association. We can see that the strength of association between the variables is very weak.
Bar chart
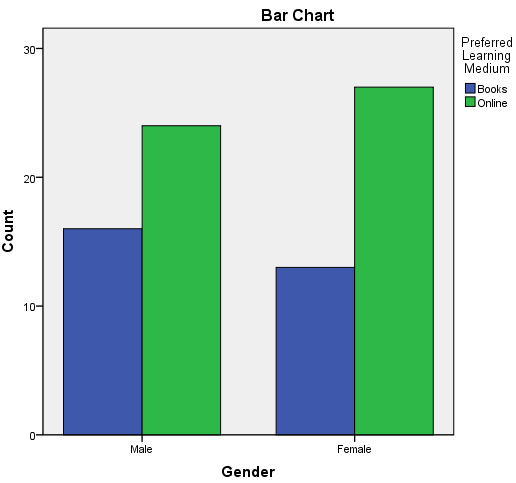
Published with written permission from SPSS Statistics, IBM Corporation.
It can be easier to visualize data than read tables. The clustered bar chart option allows a relevant graph to be produced that highlights the group categories and the frequency of counts in these groups.
