Summary
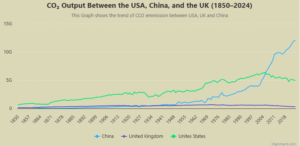
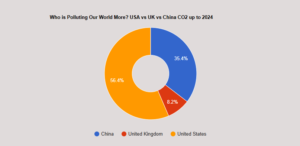
The global climate hierarchy has reached a historic turning point. While the United States dominated global $\text{CO}_2$ output for over a century, recent data through 2024 confirms that China has officially surpassed the USA as the world’s leading active emitter. This represents a profound re-ordering of the industrial era. In 2024, China’s cumulative output climbed to 35.4 billion tonnes, driven by a vertical ascent over the last two decades. While the USA remains the historical giant with a total “carbon debt” of 56.4 billion tonnes, China’s current annual trajectory has fundamentally altered the balance of global environmental responsibility.
…………………………………………………………………………………………………………………………………
The data reveals a dramatic “cross-over” effect. The United States has entered a “post-peak” phase; while its legacy debt remains the largest, its annual growth has decelerated. In contrast, China’s “vertical revolution” shows it achieving in 30 years what took Western nations 150 years. Meanwhile, the UK (8.2 billion tonnes) has become a peripheral player, serving as a case study for successfully decoupling economic growth from emissions. For policy development, these trends prove that climate justice must now account for both the duration of historical emissions and the current velocity of industrial growth.
CO₂ Output Between the USA, China, and the UK (1850–2024)
| Year | China | United Kingdom | Unites States |
|---|---|---|---|
| 1850 | 164,512,050.00 | 134,346,990.00 | 671,044,540.00 |
| 1851 | 161,213,150.00 | 126,786,184.00 | 726,396,800.00 |
| 1852 | 155,225,470.00 | 124,319,144.00 | 749,375,170.00 |
| 1853 | 147,902,130.00 | 123,705,590.00 | 789,841,340.00 |
| 1854 | 144,104,160.00 | 147,805,230.00 | 814,720,960.00 |
| 1855 | 139,180,530.00 | 137,377,680.00 | 831,577,300.00 |
| 1856 | 134,061,544.00 | 145,097,380.00 | 847,119,800.00 |
| 1857 | 131,066,904.00 | 141,783,740.00 | 868,251,840.00 |
| 1858 | 125,727,450.00 | 138,193,070.00 | 894,676,160.00 |
| 1859 | 122,288,920.00 | 151,936,560.00 | 928,601,340.00 |
| 1860 | 111,278,820.00 | 174,862,240.00 | 856,398,800.00 |
| 1861 | 93,261,620.00 | 184,589,010.00 | 784,951,000.00 |
| 1862 | 84,849,390.00 | 183,245,620.00 | 781,460,400.00 |
| 1863 | 79,105,580.00 | 197,808,370.00 | 788,982,100.00 |
| 1864 | 73,391,330.00 | 213,991,520.00 | 770,101,900.00 |
| 1865 | 51,161,850.00 | 226,921,180.00 | 744,278,000.00 |
| 1866 | 44,889,450.00 | 235,870,860.00 | 731,975,040.00 |
| 1867 | 35,469,156.00 | 243,957,660.00 | 749,451,500.00 |
| 1868 | 29,000,718.00 | 241,285,600.00 | 745,314,400.00 |
| 1869 | 21,355,282.00 | 250,930,670.00 | 734,723,650.00 |
| 1870 | 24,855,526.00 | 257,762,500.00 | 977,636,700.00 |
| 1871 | 23,229,272.00 | 268,772,800.00 | 1,088,892,900.00 |
| 1872 | 26,555,316.00 | 279,284,100.00 | 1,172,119,000.00 |
| 1873 | 23,684,964.00 | 290,594,750.00 | 1,252,588,400.00 |
| 1874 | 24,257,376.00 | 285,450,560.00 | 1,301,137,900.00 |
| 1875 | 16,310,627.00 | 298,311,070.00 | 1,339,586,800.00 |
| 1876 | 20,281,096.00 | 295,126,530.00 | 1,373,795,600.00 |
| 1877 | 25,492,134.00 | 300,211,740.00 | 1,434,670,500.00 |
| 1878 | 23,144,254.00 | 294,825,120.00 | 1,477,738,800.00 |
| 1879 | 28,262,936.00 | 295,673,600.00 | 1,556,684,200.00 |
| 1880 | 39,787,508.00 | 324,100,350.00 | 1,477,831,200.00 |
| 1881 | 56,409,708.00 | 334,822,720.00 | 1,415,980,500.00 |
| 1882 | 65,718,336.00 | 339,503,870.00 | 1,451,849,300.00 |
| 1883 | 70,203,900.00 | 353,389,200.00 | 1,491,274,200.00 |
| 1884 | 73,319,090.00 | 344,423,360.00 | 1,493,073,800.00 |
| 1885 | 68,109,864.00 | 338,686,000.00 | 1,479,776,900.00 |
| 1886 | 80,628,584.00 | 336,514,460.00 | 1,495,490,600.00 |
| 1887 | 86,494,540.00 | 345,451,230.00 | 1,539,359,200.00 |
| 1888 | 91,002,200.00 | 358,615,800.00 | 1,593,128,000.00 |
| 1889 | 99,676,770.00 | 368,237,380.00 | 1,532,567,000.00 |
| 1890 | 119,703,710.00 | 378,657,950.00 | 1,675,219,800.00 |
| 1891 | 132,626,400.00 | 384,991,330.00 | 1,727,654,800.00 |
| 1892 | 130,731,450.00 | 375,796,930.00 | 1,744,550,400.00 |
| 1893 | 135,223,490.00 | 341,457,950.00 | 1,779,292,800.00 |
| 1894 | 142,426,420.00 | 389,642,240.00 | 1,752,583,700.00 |
| 1895 | 140,021,870.00 | 391,949,440.00 | 1,804,900,100.00 |
| 1896 | 146,728,100.00 | 399,956,100.00 | 1,816,872,400.00 |
| 1897 | 158,710,740.00 | 410,506,850.00 | 1,850,322,700.00 |
| 1898 | 164,488,110.00 | 410,957,820.00 | 1,915,633,900.00 |
| 1899 | 168,074,430.00 | 438,108,900.00 | 2,015,605,900.00 |
| 1900 | 186,422,480.00 | 447,363,460.00 | 1,996,036,000.00 |
| 1901 | 207,102,980.00 | 436,761,200.00 | 2,014,727,300.00 |
| 1902 | 211,294,240.00 | 451,626,850.00 | 2,056,494,000.00 |
| 1903 | 217,199,620.00 | 453,351,260.00 | 2,163,250,200.00 |
| 1904 | 221,100,830.00 | 457,834,000.00 | 2,169,666,800.00 |
| 1905 | 225,276,780.00 | 465,559,650.00 | 2,263,132,000.00 |
| 1906 | 233,243,060.00 | 479,941,540.00 | 2,300,009,500.00 |
| 1907 | 258,855,280.00 | 497,869,920.00 | 2,470,680,600.00 |
| 1908 | 265,649,200.00 | 486,614,660.00 | 2,321,684,700.00 |
| 1909 | 278,845,900.00 | 490,554,080.00 | 2,439,606,500.00 |
| 1910 | 293,030,000.00 | 493,561,920.00 | 2,499,678,500.00 |
| 1911 | 316,606,660.00 | 508,152,060.00 | 2,469,282,800.00 |
| 1912 | 313,514,080.00 | 478,212,670.00 | 2,488,705,000.00 |
| 1913 | 317,786,200.00 | 521,977,300.00 | 2,584,020,500.00 |
| 1914 | 343,070,880.00 | 507,339,600.00 | 2,460,064,800.00 |
| 1915 | 349,989,220.00 | 513,410,020.00 | 2,477,028,400.00 |
| 1916 | 354,080,670.00 | 528,886,560.00 | 2,597,570,800.00 |
| 1917 | 367,592,320.00 | 522,783,740.00 | 2,739,310,300.00 |
| 1918 | 375,246,270.00 | 487,417,570.00 | 2,822,674,700.00 |
| 1919 | 376,427,170.00 | 475,555,940.00 | 2,524,603,600.00 |
| 1920 | 367,017,400.00 | 496,441,860.00 | 2,791,066,400.00 |
| 1921 | 358,602,140.00 | 351,578,400.00 | 2,497,550,300.00 |
| 1922 | 351,490,140.00 | 456,732,480.00 | 2,493,808,600.00 |
| 1923 | 366,919,360.00 | 481,495,140.00 | 2,934,473,000.00 |
| 1924 | 365,918,620.00 | 502,219,000.00 | 2,716,731,000.00 |
| 1925 | 370,980,350.00 | 475,915,840.00 | 2,775,957,000.00 |
| 1926 | 364,793,600.00 | 275,990,820.00 | 2,897,198,800.00 |
| 1927 | 368,541,120.00 | 495,227,740.00 | 2,825,276,700.00 |
| 1928 | 369,340,670.00 | 469,345,920.00 | 2,778,492,700.00 |
| 1929 | 386,575,170.00 | 494,471,740.00 | 2,888,793,000.00 |
| 1930 | 427,992,900.00 | 475,156,000.00 | 2,594,395,100.00 |
| 1931 | 450,831,940.00 | 444,794,850.00 | 2,307,672,000.00 |
| 1932 | 468,127,360.00 | 429,327,000.00 | 2,021,117,400.00 |
| 1933 | 479,257,730.00 | 428,815,650.00 | 2,078,726,500.00 |
| 1934 | 503,252,160.00 | 461,485,220.00 | 2,155,295,500.00 |
| 1935 | 523,326,820.00 | 466,838,080.00 | 2,166,863,000.00 |
| 1936 | 532,621,700.00 | 491,589,900.00 | 2,374,347,000.00 |
| 1937 | 534,814,300.00 | 507,456,540.00 | 2,418,741,500.00 |
| 1938 | 535,695,260.00 | 489,962,750.00 | 2,120,925,400.00 |
| 1939 | 559,823,360.00 | 490,531,500.00 | 2,251,704,800.00 |
| 1940 | 619,359,100.00 | 517,596,600.00 | 2,501,300,200.00 |
| 1941 | 665,738,400.00 | 518,238,980.00 | 2,687,883,500.00 |
| 1942 | 693,987,840.00 | 511,962,180.00 | 2,846,479,400.00 |
| 1943 | 696,362,900.00 | 510,287,870.00 | 2,921,070,800.00 |
| 1944 | 699,620,300.00 | 510,271,360.00 | 3,095,063,000.00 |
| 1945 | 668,069,060.00 | 473,490,800.00 | 3,009,799,700.00 |
| 1946 | 656,217,900.00 | 484,630,240.00 | 2,908,938,200.00 |
| 1947 | 669,197,000.00 | 506,589,200.00 | 3,137,599,200.00 |
| 1948 | 664,786,900.00 | 525,210,430.00 | 3,233,085,000.00 |
| 1949 | 698,561,400.00 | 530,168,830.00 | 2,787,645,200.00 |
| 1950 | 951,642,750.00 | 519,111,520.00 | 3,079,839,200.00 |
| 1951 | 1,195,603,200.00 | 562,752,800.00 | 3,105,518,600.00 |
| 1952 | 988,098,750.00 | 547,234,100.00 | 2,997,030,400.00 |
| 1953 | 928,184,300.00 | 559,037,500.00 | 3,032,489,000.00 |
| 1954 | 1,133,046,400.00 | 571,326,400.00 | 2,896,002,800.00 |
| 1955 | 1,109,180,000.00 | 596,927,360.00 | 3,110,046,200.00 |
| 1956 | 1,018,290,050.00 | 594,584,960.00 | 3,226,888,200.00 |
| 1957 | 1,027,921,100.00 | 591,774,000.00 | 3,172,344,300.00 |
| 1958 | 1,050,976,800.00 | 576,636,400.00 | 3,057,193,200.00 |
| 1959 | 1,135,335,700.00 | 572,533,100.00 | 3,081,779,000.00 |
| 1960 | 1,149,160,400.00 | 605,605,060.00 | 3,138,118,400.00 |
| 1961 | 1,281,117,800.00 | 624,146,400.00 | 3,039,287,000.00 |
| 1962 | 1,232,670,700.00 | 631,157,200.00 | 3,251,864,000.00 |
| 1963 | 1,320,521,100.00 | 630,114,240.00 | 3,294,024,000.00 |
| 1964 | 1,215,891,800.00 | 630,394,400.00 | 3,407,542,300.00 |
| 1965 | 1,455,521,000.00 | 641,940,900.00 | 3,508,156,400.00 |
| 1966 | 1,309,592,700.00 | 636,504,300.00 | 3,661,166,000.00 |
| 1967 | 1,009,921,200.00 | 608,883,840.00 | 4,140,472,800.00 |
| 1968 | 1,127,441,300.00 | 620,961,340.00 | 4,537,665,500.00 |
| 1969 | 1,729,135,400.00 | 638,945,860.00 | 4,448,177,000.00 |
| 1970 | 1,772,507,300.00 | 663,939,000.00 | 4,653,390,000.00 |
| 1971 | 1,546,527,500.00 | 670,804,900.00 | 4,629,813,000.00 |
| 1972 | 2,072,324,500.00 | 657,822,600.00 | 4,809,160,700.00 |
| 1973 | 2,018,559,000.00 | 668,836,400.00 | 4,981,075,000.00 |
| 1974 | 2,029,919,900.00 | 624,806,140.00 | 4,809,982,000.00 |
| 1975 | 2,061,791,600.00 | 611,722,700.00 | 4,602,336,000.00 |
| 1976 | 1,979,139,600.00 | 607,289,200.00 | 4,812,327,400.00 |
| 1977 | 2,481,384,200.00 | 612,601,150.00 | 5,034,712,000.00 |
| 1978 | 2,807,735,800.00 | 612,251,000.00 | 5,119,402,000.00 |
| 1979 | 2,316,973,600.00 | 654,241,700.00 | 5,120,397,300.00 |
| 1980 | 2,249,894,700.00 | 586,889,000.00 | 4,959,588,000.00 |
| 1981 | 2,179,172,600.00 | 568,203,600.00 | 4,765,125,600.00 |
| 1982 | 2,292,421,400.00 | 555,353,100.00 | 4,536,271,000.00 |
| 1983 | 2,358,755,000.00 | 553,546,200.00 | 4,568,584,700.00 |
| 1984 | 2,457,567,200.00 | 539,024,300.00 | 4,711,301,000.00 |
| 1985 | 2,552,835,600.00 | 567,452,400.00 | 4,736,021,000.00 |
| 1986 | 2,656,174,000.00 | 576,669,760.00 | 4,695,459,000.00 |
| 1987 | 2,778,424,000.00 | 589,268,300.00 | 4,909,506,000.00 |
| 1988 | 2,959,911,400.00 | 580,752,800.00 | 5,127,799,300.00 |
| 1989 | 3,005,707,800.00 | 590,477,700.00 | 5,191,864,300.00 |
| 1990 | 3,038,898,200.00 | 609,812,030.00 | 5,372,868,600.00 |
| 1991 | 3,139,523,000.00 | 616,195,460.00 | 5,287,870,500.00 |
| 1992 | 3,261,287,000.00 | 591,709,400.00 | 5,348,153,300.00 |
| 1993 | 3,407,007,200.00 | 579,028,200.00 | 5,434,496,000.00 |
| 1994 | 3,681,721,600.00 | 576,573,200.00 | 5,553,233,400.00 |
| 1995 | 3,836,348,000.00 | 577,644,000.00 | 5,525,777,000.00 |
| 1996 | 4,004,131,300.00 | 602,163,840.00 | 5,689,650,000.00 |
| 1997 | 4,029,845,200.00 | 571,638,000.00 | 5,773,758,500.00 |
| 1998 | 3,892,796,200.00 | 570,816,100.00 | 5,832,726,000.00 |
| 1999 | 4,023,543,300.00 | 562,480,600.00 | 5,936,663,600.00 |
| 2000 | 3,959,764,000.00 | 574,498,200.00 | 6,149,126,000.00 |
| 2001 | 3,953,659,100.00 | 583,843,300.00 | 5,938,671,000.00 |
| 2002 | 4,249,929,500.00 | 567,285,570.00 | 6,043,846,700.00 |
| 2003 | 4,966,946,000.00 | 580,625,600.00 | 6,217,231,400.00 |
| 2004 | 5,352,834,000.00 | 585,350,700.00 | 6,286,054,000.00 |
| 2005 | 5,996,144,000.00 | 606,048,200.00 | 6,394,378,000.00 |
| 2006 | 6,605,641,700.00 | 593,356,600.00 | 6,014,082,600.00 |
| 2007 | 7,066,906,000.00 | 580,060,100.00 | 6,121,165,000.00 |
| 2008 | 7,599,059,500.00 | 560,906,600.00 | 6,008,938,000.00 |
| 2009 | 8,005,223,400.00 | 507,726,430.00 | 5,555,309,000.00 |
| 2010 | 8,620,321,000.00 | 525,558,530.00 | 5,810,946,600.00 |
| 2011 | 9,575,392,000.00 | 484,728,830.00 | 5,503,278,000.00 |
| 2012 | 9,746,322,000.00 | 505,127,680.00 | 5,389,153,000.00 |
| 2013 | 9,899,617,000.00 | 494,175,100.00 | 5,486,354,400.00 |
| 2014 | 9,884,223,000.00 | 453,569,400.00 | 5,595,085,000.00 |
| 2015 | 9,834,698,000.00 | 441,949,660.00 | 5,403,733,000.00 |
| 2016 | 9,617,074,000.00 | 417,989,000.00 | 5,324,063,000.00 |
| 2017 | 9,840,138,000.00 | 400,753,400.00 | 5,322,900,000.00 |
| 2018 | 10,173,704,000.00 | 398,725,150.00 | 5,439,938,600.00 |
| 2019 | 10,494,691,000.00 | 378,022,140.00 | 5,317,247,000.00 |
| 2020 | 10,669,702,000.00 | 338,313,700.00 | 4,755,952,000.00 |
| 2021 | 11,042,185,000.00 | 351,116,200.00 | 5,096,777,000.00 |
| 2022 | 11,469,063,000.00 | 318,535,520.00 | 5,158,154,000.00 |
| 2023 | 11,921,237,000.00 | 314,260,320.00 | 5,019,620,400.00 |
| 2024 | 12,040,799,000.00 | 318,401,060.00 | 4,996,361,000.00 |
| Year | China | United Kingdom | Unites States |