You might already be familiar with the binomial distribution. It describes the scenario where the result of an observation is binary—it can be one of two outcomes. You might label the outcomes as “success” and “failure” (or not!).
Or, if you want to get mathematical about it, you might label them “1” and “0.”
You pick one of these two possible outcomes to focus on, and call the probability of that occurring p. The probability of the other outcome becomes the opposite of that, 1-p. In a modeling situation, you might try to understand how p changes with some other variables.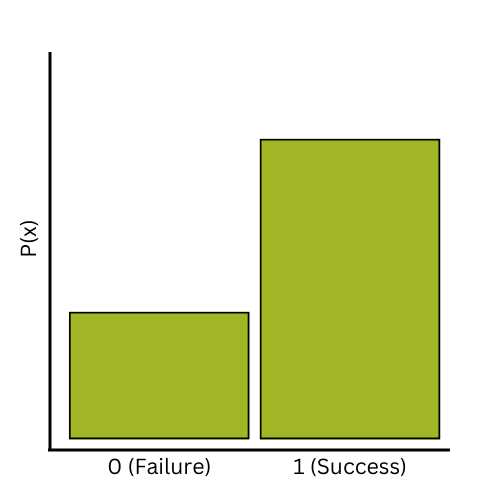
And that’s it, right? That’s the binomial distribution?
As it turns out, you’re probably technically thinking of the Bernoulli distribution. But don’t worry—they’re related.
The Bernoulli Distribution
Informally, the distribution of a variable just describes how often you will encounter different outcomes. A random variable that follows the Bernoulli distribution only has two possibly outcomes, so describing it is easy. You simply state the probability p of getting one of the outcomes.
Taking this idea a little further, we can talk about a Bernoulli trial. This is where you go through the process of obtaining an actual outcome from a Bernoulli distribution.
It might be flipping a coin and seeing which side comes up. It might be asking a person to try to complete a task and seeing if they do or not. Or it might be placing a plant in certain conditions and seeing whether it survives or dies.
So if that’s a Bernoulli, what is the binomial distribution?
The Binomial Distribution
The binomial distribution is what happens when you run multiple independent Bernoulli trials with the same p. The result is no longer which of the two Bernoulli outcomes occurs. The random variable from a binomial distribution measures the number of trials that have the outcome you are focusing on.
So for example, if you run two Bernoulli trials, the binomial variable could have outcomes of 0, 1, or 2. If you run three Bernoulli trials, the potential binomial outcomes are 0, 1, 2, or 3.
If you’re thinking this sounds like a count variable, it is! It’s a count with the important caveat that the count can only be as high as the number of trials.
As discussed, the Bernoulli distribution only requires one parameter to describe it completely, p. The binomial distribution needs two. The binomial distribution requires the p for each Bernoulli trial, and the number of trials, n.
As an example, consider flipping a coin with a 25% probability of heads. A single toss of the coin has a Bernoulli distribution, with p = 0.25. If you toss the coin three times and record the number of heads, this is now a binomial distribution with p = 0.25 and n = 3. You can use probability rules to determine the probability of 0, 1, 2, or 3 heads.
Bernoulli or Binomial?
One type of analysis we often use with binary outcomes is logistic regression. Logistic regression is meant to determine how one or more independent variables relate to the probability of one of two outcomes occurring.
Do the data for logistic regression come from the Bernoulli distribution, or from the binomial distribution?
When it comes to software, for many users it is more common that data are entered one trial at a time. Each row of the data represents one observation of a binary outcome. Something representing the specific outcome is entered in each row.
In these cases, each row is from a Bernoulli distribution. Because the independent variables change the probability p, these observations are generally each from different Bernoulli distributions.
However, most software also has a way to enter grouped data for logistic regression. If you have multiple observations where the values of the independent variables remain the same, you can enter those observations together in one row.
In each row, you include one variable that measures the total number of trials. You would also include the number of successes—those observations with the outcome of interest. The number of observations in each row is the number of Bernoulli trials, and so data entered like this come from a binomial distribution.
Regardless of whether your logistic regression is based on Bernoulli or Binomial outcome variables, in both cases, we’re interested in how the predictors relate to p, the probability of success. Of course in logistic regression, it’s expressed through the related value, the odds ratio.
A Final Thought
As already mentioned, we often use 1s and 0s to represent binary outcomes. If we do that, a Bernoulli observation is a binomial observation; it is a special case where the number of trials, n = 1. If the outcome is the one of interest (1), then one trial was a success. If it was the other outcome (0), then zero trials were a success.
And of course, we can always break down outcomes from a binomial distribution into individual Bernoulli outcomes. For most practical applications, distinguishing between the two makes very little difference.
