Testing for Normality using SPSS
Introduction
An assessment of the normality of data is a prerequisite for many statistical tests because normal data is an underlying assumption in parametric testing. There are two main methods of assessing normality: graphically and numerically.
This “quick start” guide will help you to determine whether your data is normal, and therefore, that this assumption is met in your data for statistical tests. The approaches can be divided into two main themes: relying on statistical tests or visual inspection. Statistical tests have the advantage of making an objective judgement of normality, but are disadvantaged by sometimes not being sensitive enough at low sample sizes or overly sensitive to large sample sizes. As such, some statisticians prefer to use their experience to make a subjective judgement about the data from plots/graphs. Graphical interpretation has the advantage of allowing good judgement to assess normality in situations when numerical tests might be over or under sensitive, but graphical methods do lack objectivity. If you do not have a great deal of experience interpreting normality graphically, it is probably best to rely on the numerical methods.
If you want to be guided through the testing for normality procedure in SPSS Statistics for the specific statistical test you are using to analyse your data, we provide comprehensive guides in our enhanced content. For each statistical test where you need to test for normality, we show you, step-by-step, the procedure in SPSS Statistics, as well as how to deal with situations where your data fails the assumption of normality (e.g., where you can try to “transform” your data to make it “normal”; something we also show you how to do using SPSS Statistics). You can learn about our enhanced content in general on our Features: Overview page or how we help with assumptions on our Features: Assumptions page. However, in this “quick start” guide, we take you through the basics of testing for normality in SPSS Statistics.
SPSS Statistics
Methods of assessing normality
SPSS Statistics allows you to test all of these procedures within Explore… command. The Explore… command can be used in isolation if you are testing normality in one group or splitting your dataset into one or more groups. For example, if you have a group of participants and you need to know if their height is normally distributed, everything can be done within the Explore… command. If you split your group into males and females (i.e., you have a categorical independent variable), you can test for normality of height within both the male group and the female group using just the Explore… command. This applies even if you have more than two groups. However, if you have 2 or more categorical, independent variables, the Explore… command on its own is not enough and you will have to use the Split File… command also.
SPSS Statistics
Procedure for none or one grouping variable
The following example comes from our guide on how to perform a one-way ANOVA in SPSS Statistics.
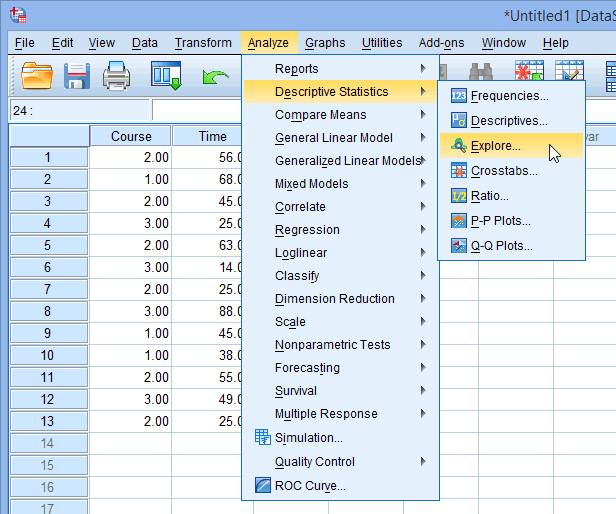
- Click Analyze > Descriptive Statistics > Explore… on the top menu, as shown below:
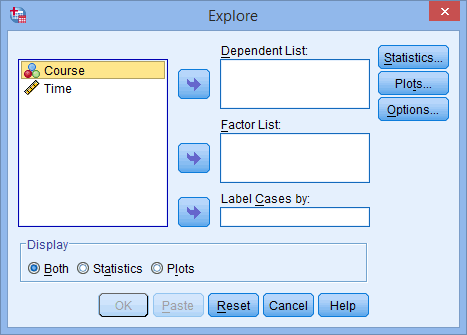
- You will be presented with the Explore dialogue box, as shown below:
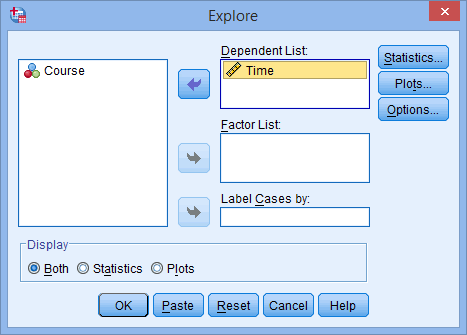
- Transfer the variable that needs to be tested for normality into the Dependent List: box by either drag-and-dropping or using the
 button. In this example, we transfer the Time variable into the Dependent List: box. You will then be presented with the following screen:
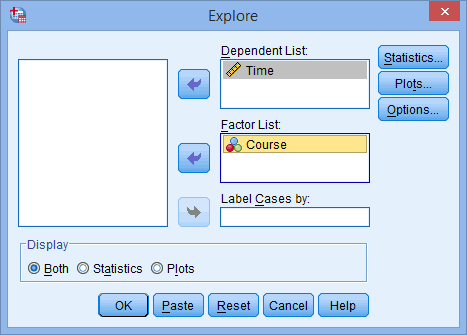
- [Optional] If you need to establish if your variable is normally distributed for each level of your independent variable, you need to add your independent variable to the Factor List: box by either drag-and-dropping or using the button. In this example, we transfer the Course variable into the Factor List: box. You will be presented with the following screen:
- Click on the
 button. You will be presented with the Explore: Statistics dialogue box, as shown below:
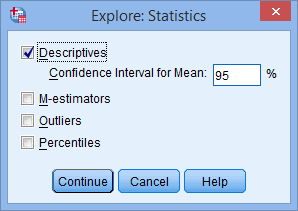
Leave the above options unchanged and click on the
 button.
 - Click on the
 button. Change the options so that you are presented with the following screen:
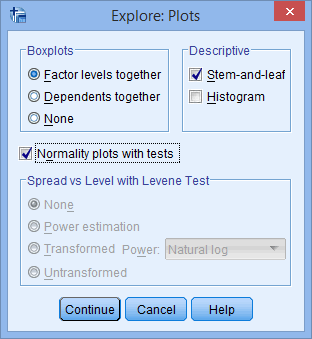
- Click on the button.
- Click on the
 button.


Output for Testing for Normality using SPSS
SPSS Statistics outputs many table and graphs with this procedure. One of the reasons for this is that the Explore… command is not used solely for the testing of normality, but in describing data in many different ways. When testing for normality, we are mainly interested in the Tests of Normality table and the Normal Q-Q Plots, our numerical and graphical methods to test for the normality of data, respectively.
Shapiro-Wilk Test of Normality
 Published with written permission from SPSS Statistics, IBM Corporation.
The above table presents the results from two well-known tests of normality, namely the Kolmogorov-Smirnov Test and the Shapiro-Wilk Test. The Shapiro-Wilk Test is more appropriate for small sample sizes (< 50 samples), but can also handle sample sizes as large as 2000. For this reason, we will use the Shapiro-Wilk test as our numerical means of assessing normality.
We can see from the above table that for the “Beginner”, “Intermediate” and “Advanced” Course Group the dependent variable, “Time”, was normally distributed. How do we know this? If the Sig. value of the Shapiro-Wilk Test is greater than 0.05, the data is normal. If it is below 0.05, the data significantly deviate from a normal distribution.
If you need to use skewness and kurtosis values to determine normality, rather the Shapiro-Wilk test, you will find these in our enhanced testing for normality guide. You can learn more about our enhanced content on our Features: Overview page.
Normal Q-Q Plot
In order to determine normality graphically, we can use the output of a normal Q-Q Plot. If the data are normally distributed, the data points will be close to the diagonal line. If the data points stray from the line in an obvious non-linear fashion, the data are not normally distributed. As we can see from the normal Q-Q plot below, the data is normally distributed. If you are at all unsure of being able to correctly interpret the graph, rely on the numerical methods instead because it can take a fair bit of experience to correctly judge the normality of data based on plots.
 Published with written permission from SPSS Statistics, IBM Corporation.
If you need to know what Normal Q-Q Plots look like when distributions are not normal (e.g., negatively skewed), you will find these in our enhanced testing for normality guide. You can learn more about our enhanced content on our Features: Overview page.
