Real Statistics Exponential Regression Capabilities
In Exponential Regression using a Linear Model we review Excel’s approach to exponential regression using linear regression. The Real Statistics Resource Pack provides a more accurate, nonlinear, exponential regression model.
Real Statistics Functions: The following functions are provided in the Real Statistics Resource Pack. Here R1 contains a column range with the values for x and R2 contains a column range with the corresponding values for y.
ExpCoeff(R1, R2, iter, lab): when lab = FALSE (default) the output is a 2 × 4 range whose first row corresponds to the alpha coefficient (intercept) and whose second row corresponds to the beta value (slope). The first column contains the regression coefficients α and β, the second column contains the corresponding standard errors for these coefficients, the third column contains the SSE and MSE terms and the fourth column contains the SSReg (= MSReg) and dfT terms. When lab = TRUE an extra row is added which contains labels.
ExpPred(R, R1, R2, iter): an m × 1 column range with the values predicted by the exponential model for R1 and R2 based on the data in the m × 1 column vector of x values.
ExpPredC(R, α, β): an m × 1 column range with the values predicted by the exponential model with coefficients α and β based on the data in the m × 1 column vector of x values.
Here iter = the number of iterations (default 20). The last two functions can also be used as ordinary (i.e. non-array) functions of the form:
ExpPred(x, R1, R2, iter) = value predicted by the exponential model for x based on the data in R1 and R2
ExpPredC(x, α, β) = value predicted by an exponential model with coefficients α and β for x
Example 1: We now show how to use these functions on the data and output from Example 1 of Exponential Regression using Newton’s Method, as repeated in Figure 1 and 2.
Figure 1 – Data for Example 1
Figure 2 – Output for Example 1
The output from the array formula =ExpCoeff(A4:A14,B4:B14,,TRUE) is as shown in range I14:L16 of Figure 3.
Figure 3 – Output from ExpCoeff
Note that the labels in column H are not included in the output. Also note that the range P25:Q26 of Figure 2 contains the formula =ExpCoeff(A4:A14,B4:B14), with the output truncated to a 2 × 2 range not containing any labels.
Example 2: We next use the exponential regression model from Example 1 to predict the y values for x = 45 and 50.
The result is shown in Figure 4.
Figure 4 – Predictions using the Exponential Regression model
Referencing Figure 2, range O15:O16 can contain the array formula
=ExpPredC(N15:N16,P25,P26).
Alternatively, referencing Figure 1, range O15:O16 can contain the array formula
=ExpPred(N15:N16,A4:A14,B4:B14).
To just predict the y value corresponding to x = 45 alone we could insert either the non-array formula =ExpPredC(N15:N16,P25,P26) or =ExpPred(N15:N16,A4:A14,B4:B14) in cell O15.
Real Statistics Data Analysis Tool: The Real Statistics Resource Pack provides the Exponential Regression data analysis tool to automate the process of creating a non-linear exponential regression model.
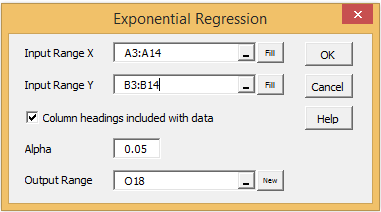
To create the model for Example 1, press Ctrl-m and double click on the Regression option from the dialog box that appears. Next, select the Exponential Regression option from the dialog box that appears and click on the OK button. Now fill in the dialog box that appears as shown in Figure 5.
Figure 5 – Exponential Regression dialog box
The output will be similar to that shown in Figure 2.


