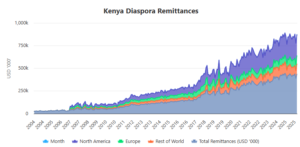
Kenya’s economic trajectory remains a focal point for regional stability in East Africa. According to the latest figures from the Central Bank of Kenya, the nation’s Nominal GDP reached Ksh 16,224,477 million in 2024, reflecting a 4.7% growth rate. While this is a slight cooling from the 5.6% recorded in 2023, it demonstrates a robust recovery from the pandemic-induced contraction of 2020 (-0.3%). This article analyzes the domestic data to understand the difference between nominal growth and real economic value, offering insights into Kenya’s path toward becoming a high-middle-income economy by 2030.
Kenya Annual GDP (Ksh)
| Year | Nominal GDP prices (Ksh Million) | Annual GDP growth (%) | Real GDP prices (Ksh Million) |
|---|---|---|---|
| 2000 | 967,838.00 | 0.00 | 982,855.00 |
| 2001 | 1,020,022.00 | 3.80 | 1,020,111.00 |
| 2002 | 1,035,374.00 | 0.50 | 1,025,583.00 |
| 2003 | 1,131,783.00 | 2.90 | 1,055,658.00 |
| 2004 | 1,274,328.00 | 5.10 | 1,109,338.00 |
| 2005 | 1,415,823.00 | 5.70 | 1,172,784.00 |
| 2006 | 1,622,565.00 | 6.50 | 1,249,470.00 |
| 2007 | 1,833,511.00 | 6.90 | 1,336,849.00 |
| 2008 | 2,107,589.00 | 1.50 | 1,357,262.00 |
| 2009 | 3,275,642.00 | 2.70 | 5,361,462.00 |
| 2010 | 3,597,630.00 | 8.10 | 5,793,514.00 |
| 2011 | 4,162,514.00 | 5.10 | 6,090,206.00 |
| 2012 | 4,767,191.00 | 4.60 | 6,368,448.00 |
| 2013 | 5,311,322.00 | 3.80 | 6,610,312.00 |
| 2014 | 6,003,835.00 | 5.00 | 6,942,157.00 |
| 2015 | 6,884,317.00 | 5.00 | 7,287,024.00 |
| 2016 | 7,594,064.00 | 4.20 | 7,594,064.00 |
| 2017 | 8,483,396.00 | 3.80 | 7,885,521.00 |
| 2018 | 9,340,307.00 | 5.60 | 8,330,891.00 |
| 2019 | 10,237,727.00 | 5.10 | 8,756,946.00 |
| 2020 | 10,715,070.00 | -0.30 | 8,733,060.00 |
| 2021 | 12,027,662.00 | 7.60 | 9,395,942.00 |
| 2022 | 13,489,642.00 | 4.90 | 9,852,583.00 |
| 2023 | 15,033,612.00 | 5.60 | 10,416,148.00 |
| 2024 | 16,224,477.00 | 4.70 | 10,908,285.00 |
| Year | Nominal GDP prices (Ksh Million) | Annual GDP growth (%) | Real GDP prices (Ksh Million) |