Basic principles & Concepts of Structural Equation Modeling (SEM)
Structural equation modeling (SEM) is a statistical technique used to analyze complex relationships among variables. It is a powerful tool that allows researchers to test and validate theoretical models by examining both observed and latent variables. SEM combines elements of factor analysis and multiple regression analysis to provide a comprehensive framework for understanding the relationships between variables.
Here are the basic principles and concepts of structural equation modeling:
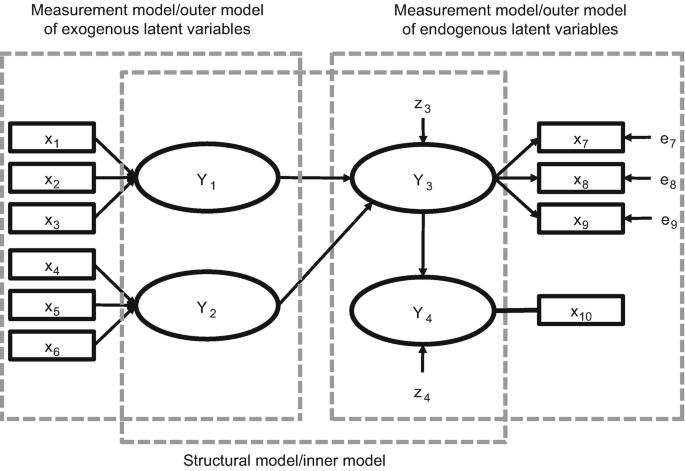
- Latent Variables: SEM allows for the inclusion of latent variables, which are not directly observed but are inferred from observed indicators. Latent variables represent underlying constructs or concepts that cannot be directly measured but can be estimated through the relationships with observed variables.
- Observed Variables: Also known as manifest variables or indicators, observed variables are directly measured variables that represent specific aspects or dimensions of the latent variables. These variables are used to assess and measure the latent constructs in the model.
- Measurement Model: The measurement model specifies the relationships between latent variables and their observed indicators. It represents how well the observed variables reflect the underlying latent constructs. In SEM, the measurement model is often represented by factor loadings, which indicate the strength and direction of the relationship between the latent variables and their indicators.
- Structural Model: The structural model represents the hypothesized relationships between latent variables. It focuses on understanding the causal pathways and direct or indirect effects between latent variables. The structural model is represented by path coefficients, which indicate the strength and direction of the relationships between latent variables.
- Path Diagram: SEM models are often depicted using path diagrams, which visually represent the relationships between variables. Latent variables are represented by ovals, and observed variables are represented by rectangles. The paths connecting variables represent the hypothesized relationships, and the path coefficients indicate the strength and direction of those relationships.
- Estimation: The estimation process in SEM involves fitting the model to the observed data to estimate the values of the parameters (e.g., factor loadings, path coefficients) that best represent the relationships in the model. The most commonly used estimation method in SEM is maximum likelihood estimation (MLE).
- Model Fit Assessment: Evaluating the fit of the model to the observed data is an essential step in SEM analysis. Fit indices, such as chi-square test, Comparative Fit Index (CFI), Root Mean Square Error of Approximation (RMSEA), and others, are used to assess how well the model fits the data. A good-fitting model indicates that the hypothesized relationships are supported by the observed data.

By utilizing SEM, researchers can gain insights into complex relationships, test theoretical models, and make more accurate predictions. It is a versatile approach that is widely used in various fields, including psychology, social sciences, economics, and marketing, to name a few.
Structural equation modeling is a powerful technique used in multivariate data analysis to examine intricate connections among constructs and indicators. Researchers typically employ two primary methods to estimate structural equation models: covariance-based SEM (CB-SEM) and partial least squares SEM (PLS-SEM).
CB-SEM focuses on theory confirmation, while PLS-SEM adopts a causal-predictive approach that prioritizes prediction and causal explanations in model estimation. Moreover, PLS-SEM serves as a valuable tool for validating measurement models.


