How to Summarize Data with Pandas, Python. Are you starting to learn how to analyze data using Python Pandas? If yes, this post is for you. We will go over different functions used to summarize data contained in a pandas dataframe.
For demonstration purposes, I used the Supermarket Sales data set from Kaggle. I downloaded the file and saved it in my local drive.
#import library
import pandas as pd
#import file
ss = pd.read_csv('supermarket_sales.csv')
#preview data
ss.head()

- info(): provides a concise summary of a dataframe.
I use this method every time I am working with pandas especially when doing data cleaning. It shows you all the information you need to know about your dataframe like: record counts, column names, data types, index range , and memory usage.
By looking at the summary provided for ss.info() below we can observe:
- record count is 1000
- composed of 17 columns
- Column names can be updated to eliminate white spaces
- Data types included are object, float64 and int
- Date and Time columns are dtype = object, should be updated to corresponding datetime formats.
- There are no missing values on any of the records

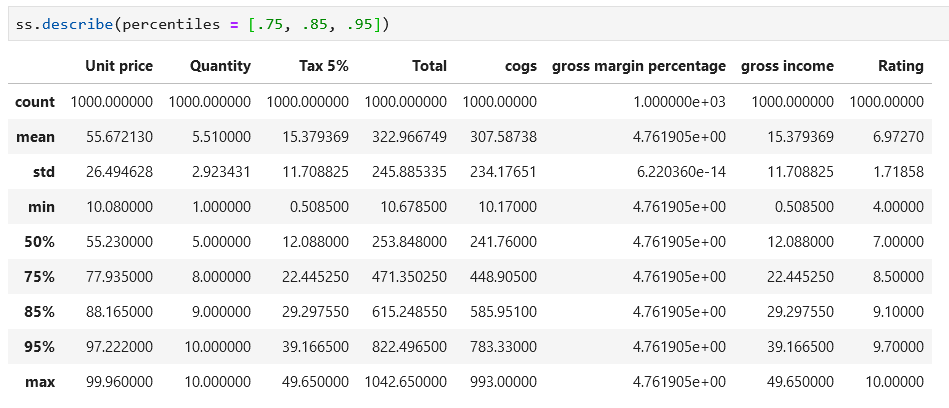
2. describe(): Generates descriptive statistics that will provide visibility of the dispersion and shape of a dataset’s distribution. It excludes NaN values. It can be used for dataframe or a specific series.


By default, the results are for numeric types, but you can use the parameter include to show the stats for some or all the data types in the dataframe.


You can exclude specific data types from a dataframe as well with the exclude parameter:

By default, the percentiles returned by this function are the 25th, 50th and 75th. If you wish to change the percentiles in the results, you can add those by using the parameter percentiles. Values must be between 0 and 1. This applies for both dataframe and series:

3. value_counts(): returnscounts of unique values for the specified series. NaN values are excluded by default.

By default, the results are listed in descending order, but you can change it by using parameter ascending = True

You can get the frequency (instead of count) for each value by setting the normalize = True

4. nunique(): Count distinct observations. Can be used for a dataframe or a series. By default, it exclude the NaN values.


If you need to include the NaN values, use the parameter dropna= False
Since this dataset does not contains any NaN values, let us create a dataframe for this example:
d = {'A': [1, 2, None], 'B': [3, 4, 2], 'C': [3, None, None]}
df = pd.DataFrame(d)
df


Now see how the dropna parameter set to False changes the results:

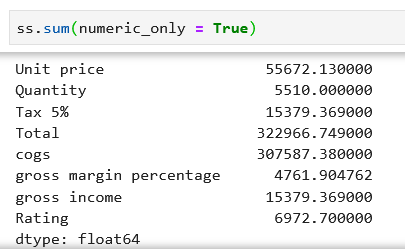
5. sum(): Return the sum of the values for the requested axis. You can use it for both dataframe and series.


You can specify to apply the function only to numeric types by using the parameter: numeric_only = True
Another useful parameter is min_count where you can set the minimum number of records that must exists to apply the function.
Let’s create another dataframe to demo how this parameter works:
d = {'A': [1, 2, None, 5, 8], 'B': [3, 4, 2, 4, 5],
     'C': [3, None, None, 3, 4]}
df = pd.DataFrame(d)
df


6. count(): Return number of non-NA/null observations.
Can be applied to both dataframe and series:
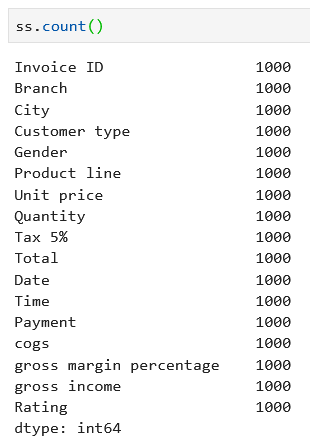

Use the parameter numeric_only = True to apply functions to only series with numeric data types.

7. Min and Max, Mean and Median:
a. min(): Return the minimum value
b. max(): Return the maximum value
c.mean(): Return the mean of the values
d. median(): Return the median of the values
These functions can be applied to both dataframe and series:


Summary
In this post we went over some functions to get summarized data from a pandas dataframe. We used .info() to get information about the structure and format of our dataframe. We used .describe() to get descriptive statistic about the data. Then we showed how to get the counts per columns with .counts(); values grouped and their counts with .value_counts(), how many unique values a column has with .nunique() and finally functions to obtain the maximum and minimum values with .max() and .min() as well as the median and mean values with .median() and .mean(). Thanks for reading!
