Today, I will teach you how to find Missing values in a data frame using Python Pandas
Introduction:
When you start working on any data science project the data you are provided is never clean. One of the most common issue with any data set are missing values. Most of the machine learning algorithms are not able to handle missing values. The missing values needs to be addressed before proceeding to applying any machine learning algorithm.
Missing values can be handled in different ways depending on if the missing values are continuous or categorical. In this section I will address how to find missing values. In the next article i will address on how to address the missing values.
Finding Missing Values:
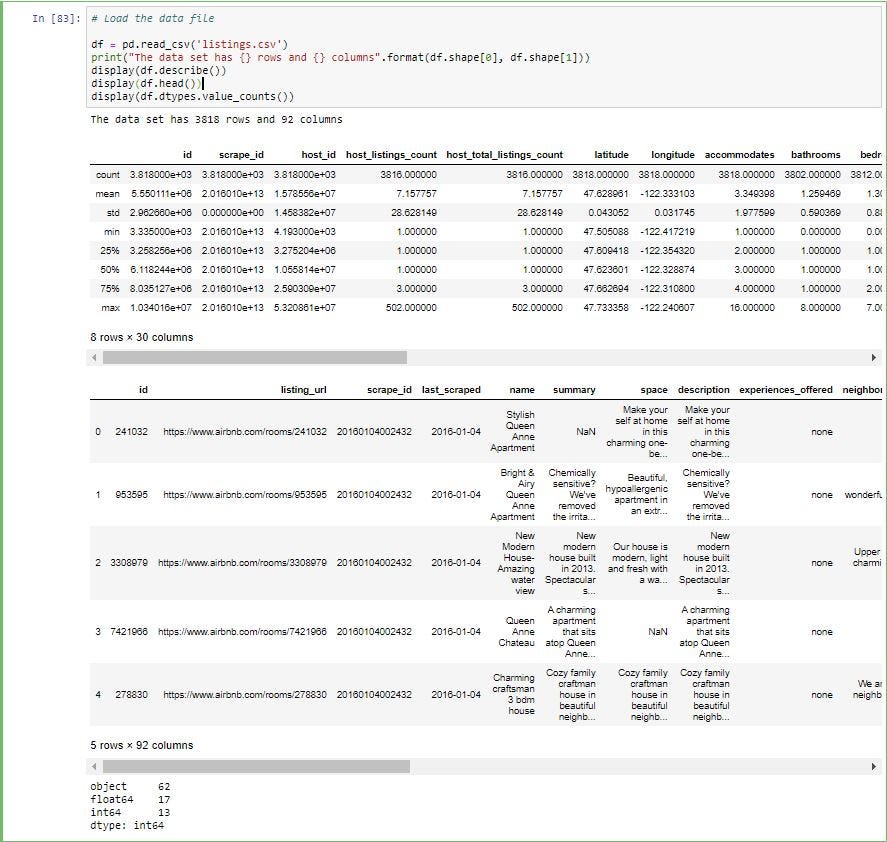
For this exercise i will be using “listings.csv” data file from Seattle Airbnb data. The data can be found under this link : https://www.kaggle.com/airbnb/seattle?select=listings.csv
Step 1: Load the data frame and study the structure of the data frame.
First step is to load the file and look at the structure of the file. When you have a big dateset with high number of columns it is hard to look at each columns and study the types of columns.
To find out how many of the columns are categorical and numerical we can use pandas “dtypes” to get the different data types and you can use pandas “value_counts()” function to get count of each data type. Value_counts groups all the unique instances and gives the count of each of those instances.
As you can see below we have 62 columns which are objects (categorical data), 17 columns which are of float data type and 13 columns which are of int data type.
Step 2: Separate categorical and numerical columns in the data frame
The reason to separate the categorical and numerical columns in the data frame is the method of handling missing values are different between these two data type which i will walk through in the next section.
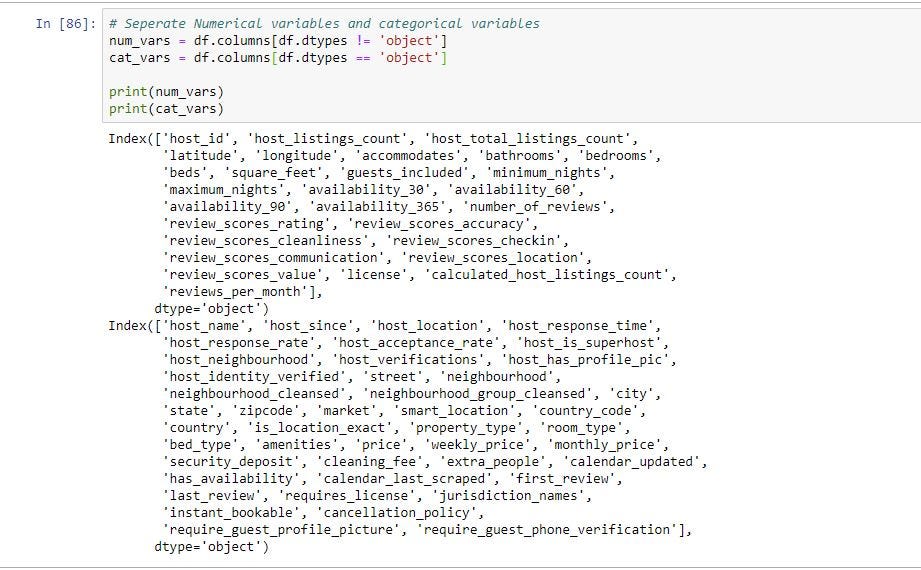
The easiest way to achieve this step is through filtering out the columns from the original data frame by data type. By using “dtypes” function and equality operator you can get which columns are objects (categorical variable) and which are not.
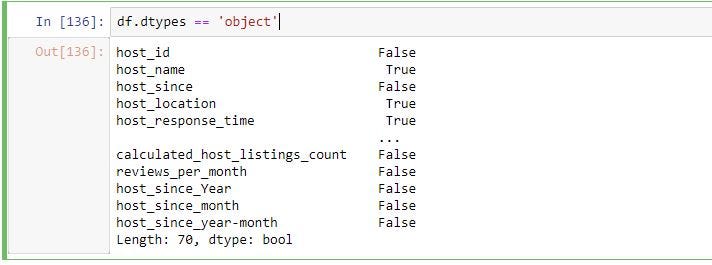
To get the column names of the columns which satisfy the above conditions we can use “df.columns”. The below code gives column names which are objects and column names which are not objects.
As you can see below we separated the original data frame into 2 and assigned them new variables. One for for categorical variables and one for non-categorical variables.
Step 3: Find the missing values
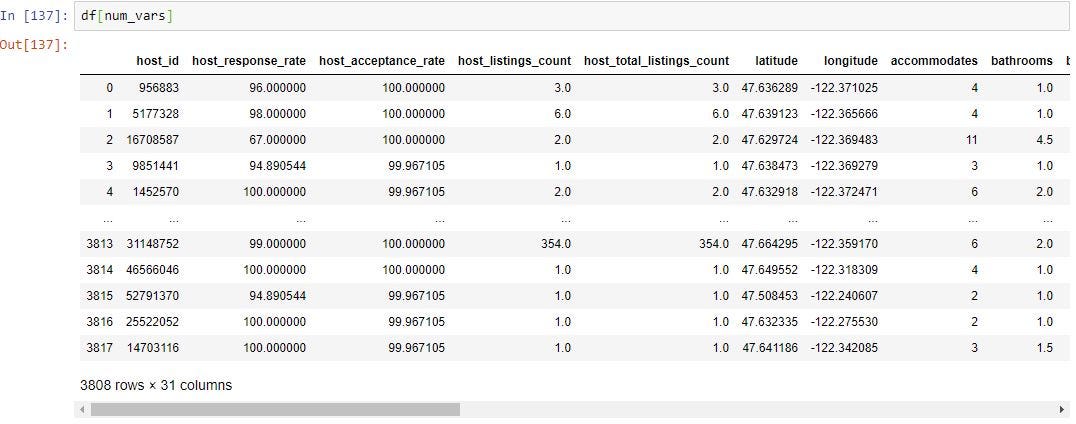
Finding the missing values is the same for both categorical and continuous variables. We will use “num_vars” which holds all the columns which are not object data type.
df[num_vars] will give you all the columns in “num_vars” which consists of all the columns in the data frame which are not object data type.
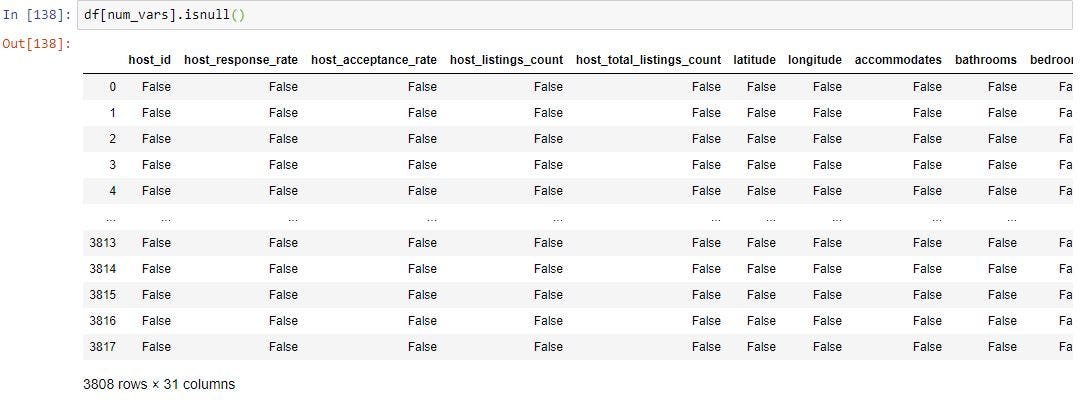
We can use pandas “isnull()” function to find out all the fields which have missing values. This will return True if a field has missing values and false if the field does not have missing values.
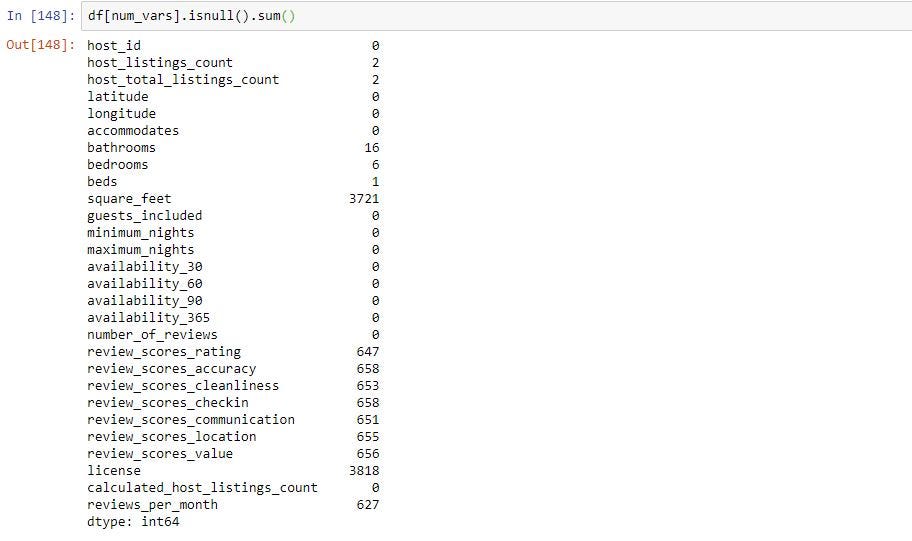
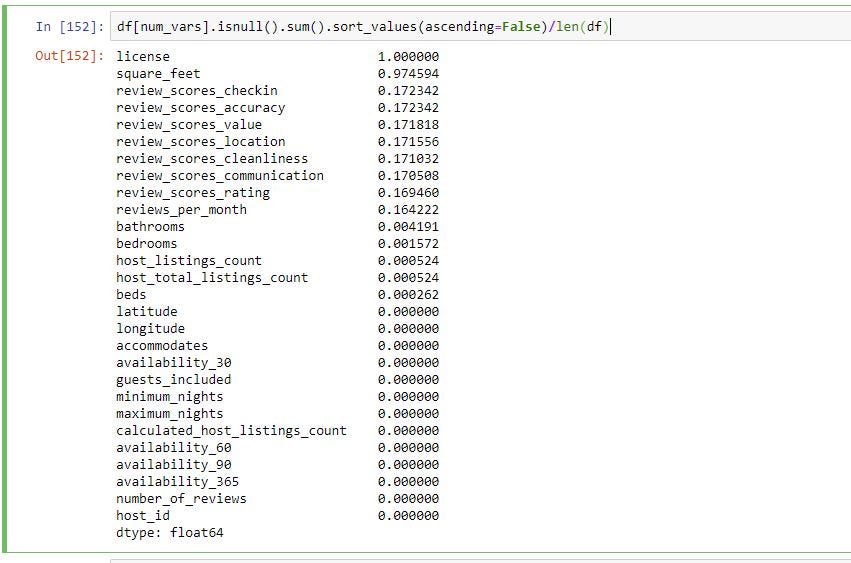
To get how many missing values are in each column we use sum() along with isnull() which is shown below. This will sum up all the True’s in each column from the step above.
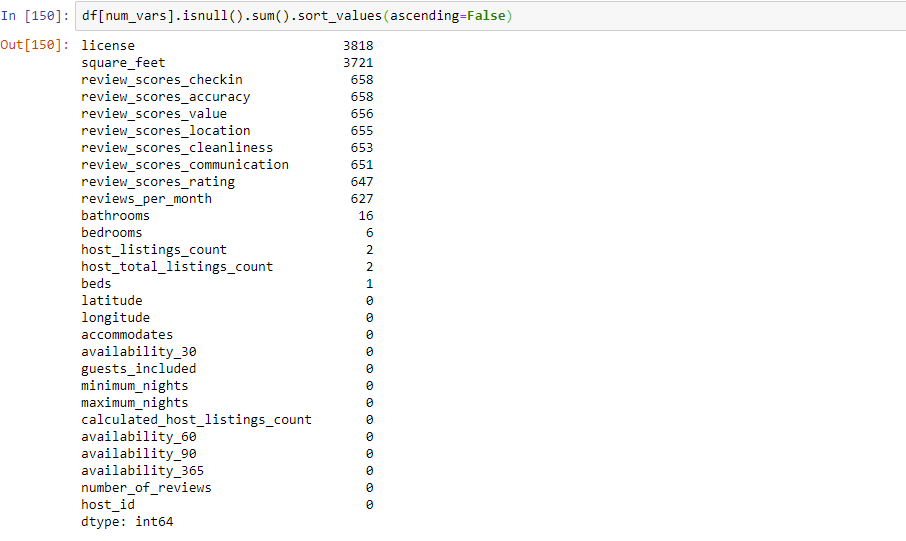
Its always good practice to sort the columns in descending order so you can see what are the columns with highest missing values. To do this we can use sort_values() function. By default this function will sort in ascending order. Since we want the columns with highest missing values first we want to set it to descending. You can do this by passing “ascending=False” paramter in sort_values().
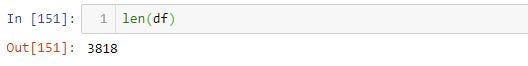
The above give you the count of missing values in each column. To get % of missing values in each column you can divide by length of the data frame. You can “len(df)” which gives you the number of rows in the data frame.
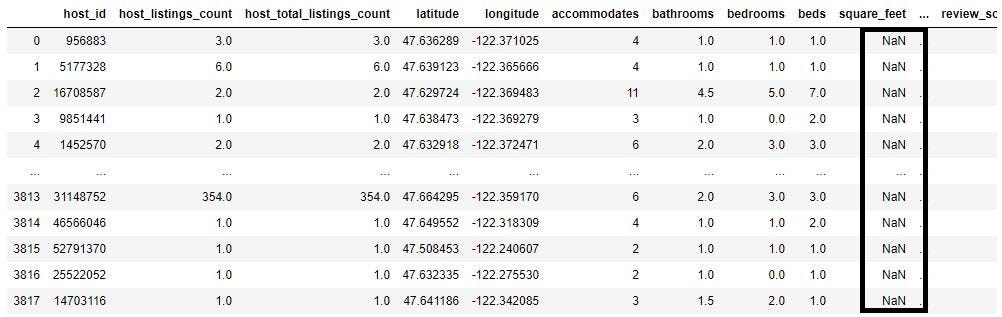
As you can see below license column is missing 100% of the data and square_feet column is missing 97% of data.
Conclusion
The above article goes over on how to find missing values in the data frame using Python pandas library. Below are the steps
- Use isnull() function to identify the missing values in the data frame
- Use sum() functions to get sum of all missing values per column.
- use sort_values(ascending=False) function to get columns with the missing values in descending order.
- Divide by len(df) to get % of missing values in each column.
In this section we identified missing values, in the next we go over on how to handle these missing values.
