How to Conduct Structural Equation Modeling (SEM) with AMOS
A flexible statistical method called structural equation modeling (SEM) enables researchers to look into intricate connections between observable and latent variables. AMOS (Analysis of Moment Structures) is an effective piece of software for SEM. We will lead you through the process of performing SEM using AMOS in this systematic manual.
Step 1: Step 1 involves ensuring that the data intended to be used for the confirmatory factor analysis is clean and correctly labeled and in a format such as SPSS or csv file format.
Step 2: In step two, we build the SEM model after launching AMOS on the computer.
Step 3: In step three, we now add variables to the model created by drawing the variables for the analysis. Use one-headed arrows to indicate the direction of the relationship between your variables and the latent components (constructs) they represent. To specify the factor loadings (regression coefficients) between the latent components and observable variables, double-click on the arrows to define relationships.
Step 4: Step 4 involves specifying the error terms connect the latent variables to the error terms with double-headed arrows to account for measurement error. For a definition of the measurement mistakes (variances), double-click on the error words.

Step 5: Step 5 involves model modification and estimations. Go to the “Analyze” menu and choose “Estimation.” Select your estimating strategy (usually Maximum Likelihood) and make any necessary changes to the other settings. For your model, AMOS will offer the initial fit statistics. If the fit is unsatisfactory, your model might need to be modified. If you want to change your model, right-click on the arrows or routes and choose “Edit Parameters.”
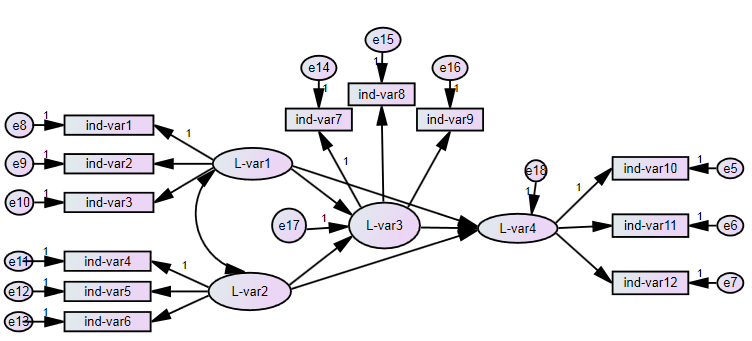
Step 6: Step 6 involves assessing the model fit by using the fit indices such as chi-square, RMSEA output after estimation. A well-fitting model typically has the fit indices close to their ideal values such as RMSEA being less than 0.08. if the model fit does not align to the desired goals the model may be modified or the researcher looks for the sources of misfit. Below is an image of SEM performed.
Step 7: Step 7 involves the saving of the project for future reference reporting of the findings. The reporting includes a summary of the SEM results; model fit statistics factor loadings and the interpretations.