Today I will teach you how to Conduct and Interpret a Multinomial Logistic Regression in SPSS
What is Multinomial Logistic Regression?
Multinomial Logistic Regression is the regression analysis to conduct when the dependent variable is nominal with more than two levels. Similar to multiple linear regression, the multinomial regression is a predictive analysis. Multinomial regression is used to explain the relationship between one nominal dependent variable and one or more independent variables.
Standard linear regression requires the dependent variable to be measured on a continuous (interval or ratio) scale. Binary logistic regression assumes that the dependent variable is a stochastic event. The dependent variable describes the outcome of this stochastic event with a density function (a function of cumulated probabilities ranging from 0 to 1). A cut point (e.g., 0.5) can be used to determine which outcome is predicted by the model based on the values of the predictors.
How can we apply the binary logistic regression principle to a multinomial variable (e.g. 1/2/3)?
Example:
We analyze our class of pupils that we observed for a whole term. At the end of the term we gave each pupil a computer game as a gift for their effort. Each participant was free to choose between three games – an action, a puzzle or a sports game. The researchers want to know how pupils’ scores in math, reading, and writing affect their choice of game. Note that the choice of the game is a nominal dependent variable with three levels. Therefore, multinomial regression is an appropriate analytic approach to the question.
How do we get from binary logistic regression to multinomial regression? Multinomial regression is a multi-equation model. For a nominal dependent variable with k categories, the multinomial regression model estimates k-1 logit equations. Although SPSS does compare all combinations of k groups, it only displays one of the comparisons. This is typically either the first or the last category.
What are logits? The basic idea behind logits is to use a logarithmic function to restrict the probability values between 0 and 1. Sometimes a probit model is used instead of a logit model for multinomial regression. The following graph shows the difference between a logit and a probit model for different values. Both models are commonly used as the link function in ordinal regression. However, most multinomial regression models are based on the logit function. A noticeable difference between functions is typically only seen in small samples because probit assumes a normal distribution of the probability of the event, whereas logit assumes a log distribution.
At the center of the multinomial regression analysis is the task estimating the log odds of each category. In our k=3 computer game example with the last category as the reference category, the multinomial regression estimates k-1 regression functions.
Multinomial regression is similar to discriminant analysis. The practical difference is in the assumptions of both tests. If the independent variables are normally distributed, then we should use discriminant analysis because it is more statistically powerful and efficient.
The Multinomial Logistic Regression in SPSS
For multinomial logistic regression, we consider the following research question based on the research example described previously:
How does the pupils’ ability to read, write, or calculate influence their game choice?
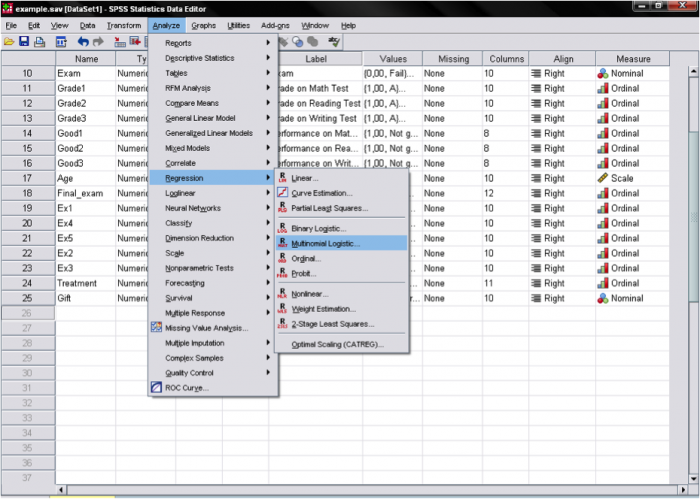
Multinomial Regression is found in SPSS under Analyze > Regression > Multinomial Logistic…
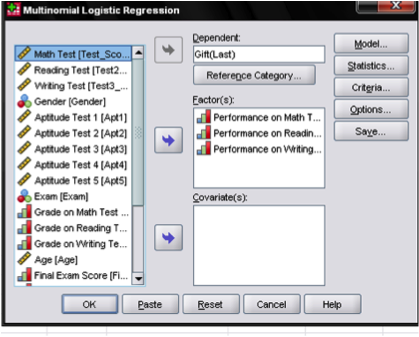
This opens the dialog box to specify the model. Here we need to enter the dependent variable Gift and define the reference category. In our example it will be the last category because we want to use the sports game as a baseline. Then we enter the three independent variables into the “Factor(s)” box. The factors are performance (good vs. not good) on the math, reading, and writing test. We use the “Factor(s)” box because the independent variables are dichotomous. If the independent variables were continuous (interval or ratio scale), we would place them in the “Covariate(s)” box.
In the “Model…” menuwe can specify the model for the multinomial regression if any stepwise variable entry or interaction terms are needed.
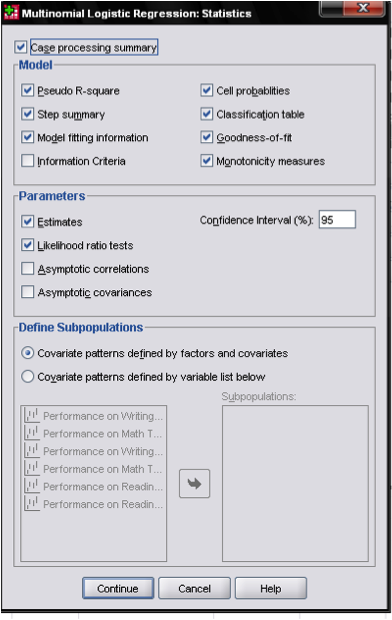
If we want to include additional output, we can do so in the dialog box “Statistics…”


