Fit of the Regression Line
Basic Concepts
On this webpage, we show how to test the following null hypothesis:
H0: the regression line doesn’t capture the relationship between the variables
If we reject the null hypothesis it means that the line is a good fit for the data. We now express the null hypothesis in a way that is more easily testable:
H0: ≤
As described in Two Sample Hypothesis Testing to Compare Variances, we can use the F test to compare the variances in two samples. To test the above null hypothesis we set F = MSReg/MSRes and use dfReg, dfRes degrees of freedom.
Assumptions
The use of the linear regression model is based on the following assumptions:
- Linearity of the phenomenon measured
- Constant variance of the error term
- Independence of the error terms
- Normality of the error term distribution
In fact, the normality assumption is equivalent to the condition that the sample comes from a population with a bivariate normal distribution. See Multivariate Normal Distribution for more information about this distribution. The homogeneity of the variance assumption is equivalent to the condition that for any values x1 and x2 of x, the variance of y for those x are equal, i.e.
Linear regression can be effective with a sample size as small as 20.
Example
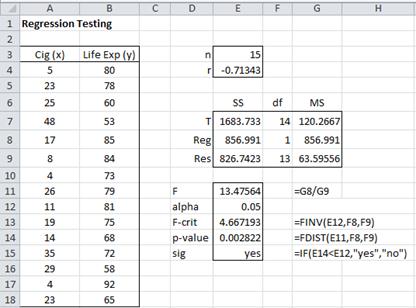
Example 1: Test whether the regression line in Example 1 of Method of Least Squares is a good fit for the data.
Figure 1 – Goodness of fit of regression line for data in Example 1
We note that SST = DEVSQ(B4:B18) = 1683.7 and r = CORREL(A4:A18, B4:B18) = -0.713, and so by Property 3 of Regression Analysis, SSReg = r2·SST = (1683.7)(0.713)2 = 857.0. By Property 1 of Regression Analysis, SSRes = SST – SSReg = 1683.7 – 857.0 = 826.7. From these values, it is easy to calculate MSReg and MSRes.
We now calculate the test statistic F = MSReg/MSRes = 857.0/63.6 = 13.5. Since Fcrit = F.INV(α, dfReg, dfRes) = F.INV(.05, 1, 13) = 4.7 < 13.5 = F, we reject the null hypothesis, and so accept that the regression line is a good fit for the data (with 95% confidence). Alternatively, we note that p-value = F.DIST.RT(F, dfReg, dfRes) = F.DIST.RT(13.5, 1, 13) = 0.0028 < .05 = α, and so once again we reject the null hypothesis.
Observations
There are many ways of calculating SSReg, SSRes, and SST. E.g. using the worksheet in Figure 1 of Regression Analysis, we note that SSReg = DEVSQ(K5:K19) and SSRes = DEVSQ(L5:L19). These formulas are valid since the means of the y values and ȳ values are equal by Property 5(b) of Regression Analysis.
Also by Definition 2 of Regression Analysis, SSRes = (yi – ŷi)2 = SUMXMY2(J5:J19, K5:K19). Finally, SST = DEVSQ(J5:J19), but alternatively SST = var(y) ∙ dfT = VAR(J5:J19) * (COUNT(J5:J19)-1).


