Confidence and prediction intervals for forecasted values
Objective
On this webpage, we explore the concepts of a confidence interval and prediction interval associated with simple linear regression, i.e. a linear regression with one independent variable x (and dependent variable y), based on sample data of the form (x1, y1), …, (xn, yn). We also show how to calculate these intervals in Excel. In Confidence and Prediction Intervals we extend these concepts to multiple linear regression, where there may be more than one independent variable.
Confidence Interval
The 95% confidence interval for the forecasted values ŷ of x is
Here, sy⋅x is the standard estimate of the error, as defined in Definition 3 of Regression Analysis, Sx is the squared deviation of the x-values in the sample (see Measures of Variability), and tcrit is the critical value of the t distribution for the specified significance level α divided by 2. How to calculate these values is described in Example 1, below.
The 95% confidence interval is commonly interpreted as there is a 95% probability that the true linear regression line of the population will lie within the confidence interval of the regression line calculated from the sample data. This is not quite accurate, as explained in Confidence Interval, but it will do for now.
Figure 1 – Confidence vs. prediction intervals
In the graph on the left of Figure 1, a linear regression line is calculated to fit the sample data points. The confidence interval consists of the space between the two curves (dotted lines). Thus there is a 95% probability that the true best-fit line for the population lies within the confidence interval (e.g. any of the lines in the figure on the right above).
Prediction Interval
There is also a concept called a prediction interval. Here we look at any specific value of x, x0, and find an interval around the predicted value ŷ0 for x0 such that there is a 95% probability that the real value of y (in the population) corresponding to x0 is within this interval (see the graph on the right side of Figure 1). Again, this is not quite accurate, but it will do for now.
The 95% prediction interval of the forecasted value ŷ0 for x0 is
where the standard error of the prediction is
For any specific value x0 the prediction interval is more meaningful than the confidence interval.
Example
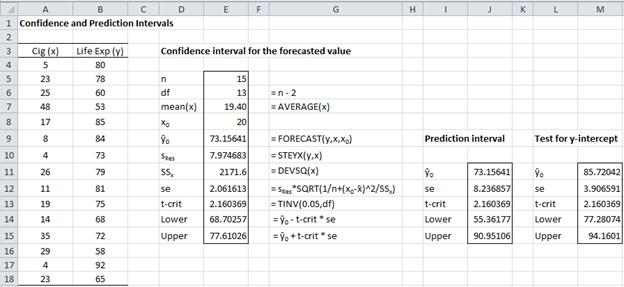
Example 1: Find the 95% confidence and prediction intervals for the forecasted life expectancy for men who smoke 20 cigarettes in Example 1 of Method of Least Squares.
Figure 2 – Confidence and prediction intervals
Referring to Figure 2, we see that the forecasted value for 20 cigarettes is given by FORECAST(20,B4:B18,A4:A18) = 73.16. The confidence interval, calculated using the standard error of 2.06 (found in cell E12), is (68.70, 77.61).
The prediction interval is calculated in a similar way using the prediction standard error of 8.24 (found in cell J12). Thus life expectancy of men who smoke 20 cigarettes is in the interval (55.36, 90.95) with 95% probability.
Graphical representation
You can create charts of the confidence interval or prediction interval for a regression model. This is demonstrated at Charts of Regression Intervals. You can also use the Real Statistics Confidence and Prediction Interval Plots data analysis tool to do this, as described on that webpage.
Testing the y-intercept
Example 2: Test whether the y-intercept is 0.
We use the same approach as that used in Example 1 to find the confidence interval of ŷ when x = 0 (this is the y-intercept). The result is given in column M of Figure 2. Here the standard error is
and so the confidence interval is
Since 0 is not in this interval, the null hypothesis that the y-intercept is zero is rejected.


