Discriminant Validity using SPSS
Your main reason for conducting discriminant validity for your study will be to show how distinct an item or set of items is from others. In other words, you are interested in showing that items measuring different constructs or variables have poor relationships or low correlation exist between them. If you fail to test for discriminant validity among your variables, there could be a chance that some items will have a good relationship with non-related items – a clear indication of a lack of discriminant validity.
Let’s take a look at this example:
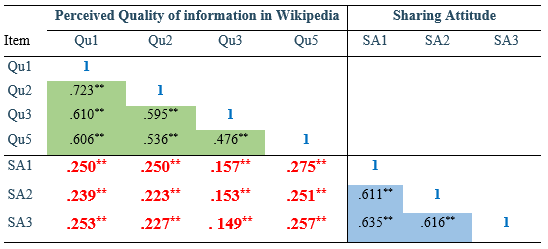
Suppose we have two different constructs, Perceived Quality of Information in Wikipedia (Qu1, Qu2, Qu3 and Qu5) and Sharing Attitude (SA1 – SA3), then as shown in Table 2, the bolded items in red represents discriminant validity. As you can see, the correlation between SA2 and Q1 is .239, which is lower when compared to the correlation between items of the same construct like SA3 and SA2 (.616) or Qu2 and Qu1 (.723).
The easiest way to establish discriminant validity is through correlation coefficient. In SPSS, we can achieve this purpose by following the steps below:
- Click Analysis → Correlate → Bivariate. You will be presented with the window below.
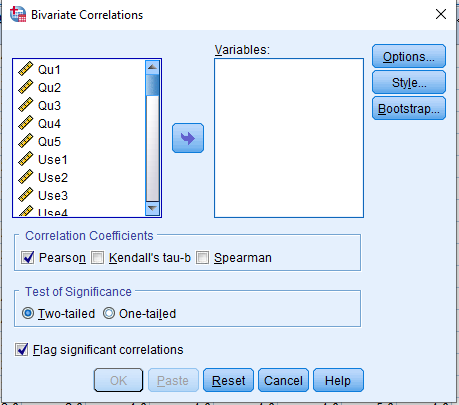
- Move all the items measuring the constructs into the Variable: box. In our case, Perceived Quality of Information in Wikipedia and Sharing Attitude.
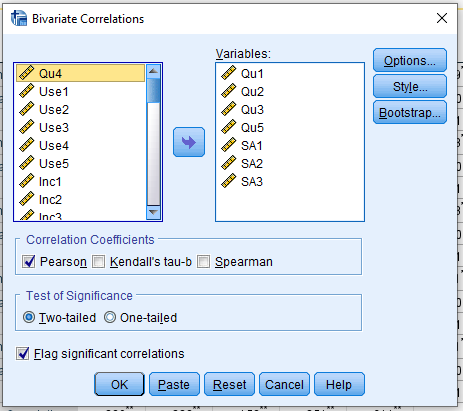
- Click OK to view output.
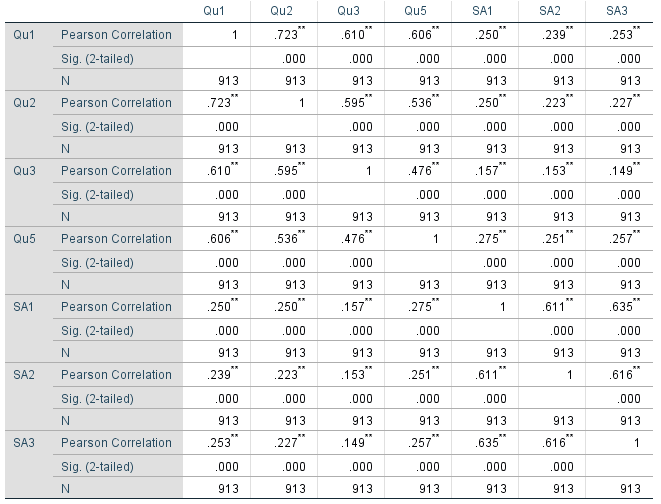
In the output:
Pearson Correlation is the correlation coefficient between the items of interest.
Sig. (2 tailed) tells us whether the respective correlation is significant or not; and if significant, at what level of significance? Is it at p-value < 0.05 (designated by *), p-value < 0.01 (designated by **) or p-value < 0.001 (represented by ***).
N represents the sample size. In our case, it is 913.
We shall discuss this in detail in a future post.
You should by now realize the diagonal elements are the same. Reformatting the above table yields the table below.
It is worth noting that for the majority of researches done in the social/behavioural sciences, discriminant validity is not tested at the item level as done above. Rather, researchers employ at least one of the following methods to confirm the distinct nature of their variables.
- Cross loadings
- Fronell-Larcker Criterion
- Heterotrait-monotrait ratio of correlation (HTMT)
